Order Execution
Trade execution tools facilitate fast, precise, and efficient order placement in day trading. They help traders capitalize on market opportunities by reducing execution delays, slippage, and human error.
cTrader Forex Smart Trade Panel
This cTrader Forex Smart Trade Panel cBot provides a fast, controlled way to place and manage manual trades directly from the chart. The modern panel lets you switch between fixed volume and risk per cent, set SL and TP in pips, and see how much of your account is at risk before you click buy or sell. Built-in equity drawdown protection, break-even, and trailing stop management help you enforce consistent risk control on every trade.
£14.99
Excl. VAT
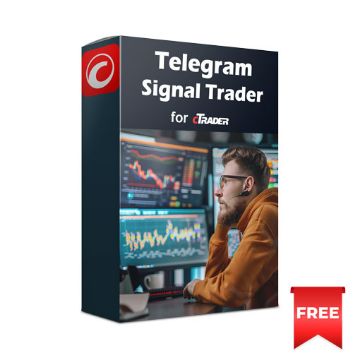
cTrader Telegram Signal Trader
The Telegram Signal Trader cBot for cTrader automatically reads trading instructions from your Telegram messages and executes them as live trades. It can process market orders, pending orders, and custom trade sizes directly from simple chat commands, helping you automate signal-based trading without manually copying trades. Built for traders who follow Telegram signal groups, this tool bridges messaging and execution for seamless trading.
Free
cTrader Twitter Trader
Using the Twitter API, the Twitter Trading Bot for cTrader scans recent tweets containing keywords like Trump. It analyzes tweet content for trading signals, explicitly checks for your buy or sell phrases, and executes market orders. The bot runs continuously on every tick, ensuring real-time trade execution based on social media sentiment. This approach leverages news-driven trading to capitalize on market reactions to trending topics.
Free
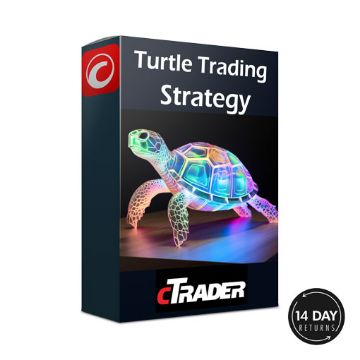
cTrader Turtle Trading Scanner
The Turtle Trading system is a well-known trend-following strategy created by Richard Dennis and William Eckhardt in the 1980s. Their idea was simple yet groundbreaking: anyone could become a successful trader if they followed a clear set of rules. To prove this, Dennis and Eckhardt handpicked a group of complete beginners, dubbed the Turtles, and taught them a specific set of trading guidelines. The experiment validated their theory and turned the Turtles into successful traders.
Free
cTrader Professional Trading Tools
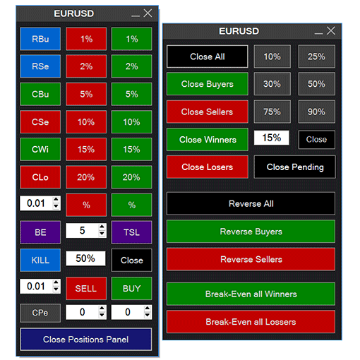
The cTrader Trading Software Widget Collection allows you to trade like a professional, the one-click risk management panel allows you to predefine your risk so that you can execute trades with a single click using a simple interface; knowing that each trade entered is fully protected.
Discontinued
cTrader Risk Calculator Assistant
The cTrader Risk Calculator Assistant is an on-screen panel similar to magic keys that will allow you to quickly submit, close and manage your trades with lightning speed. Total Risk Management with a click of the mouse & is perfect for scalping Forex, Indices, and Crypto or Shares. Try it on a 14-day free trial.
£24.99
Excl. VAT
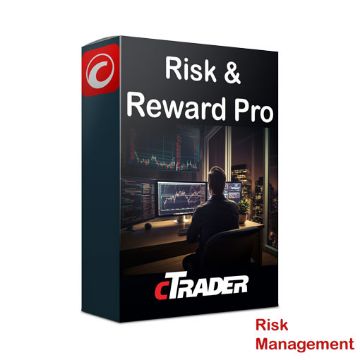
cTrader Risk & Reward Professional
The cTrader Risk & Reward Professional Indicator is an advanced Risk Management & Trade Automation tool that allows visual pre-planning with
1. One-click trading
2. Trade execution with up to 4 dynamic take-profit targets
3. Position management features for every situation
The position size is calculated in real-time based on the percentage of the equity or a fixed amount. This tool is packed full of must-have features for any trader.
1. One-click trading
2. Trade execution with up to 4 dynamic take-profit targets
3. Position management features for every situation
The position size is calculated in real-time based on the percentage of the equity or a fixed amount. This tool is packed full of must-have features for any trader.
Partner
cTrader One-Click Trading Terminal
The cTrader One-Click Trading Terminal software allows you to trade like a professional, the risk management panel allows you to define your risk so that you can execute trades with a single click using a simple interface; knowing that each trade entered is fully protected. You will also have the option to dynamically set the stop loss and take profit to the last price swing high and low with the added option to set up Stealth orders.
£29.99
Excl. VAT
cTrader Advanced FX Trade Terminal
Why not experience trading at an advanced level on one of the world's most popular trading platforms with cTrader, while taking advantage of ClickAlgo's trader-centric solutions? The mini-trading terminal will allow you to trade with ease as well as submit complex order types.
Free
cTrader Trade Stacker & Duplicator
This nifty little tool will allow you to open multiple stacked duplicate marker orders all at the same time whenever an order is submitted manually or via an automated strategy.
Free
Algo Strategy Builder
The cTrader Algorithmic Strategy Builder is a basic tool for traders to create, test, and execute customised strategies based on technical analysis, trade rules and risk management. The tool also has a feature that automatically generates Microsoft C# source code for the strategy built and imports it into cTrader to build cBots and make modifications. It can also be used to send trade signals for manual trading. No coding experience required.
£34.99
Excl. VAT
Voice Recognition Trading Robot
Would you like to communicate with your cTrader trading platform with a few simple words? We have developed a prototype voice recognition trading assistant that will allow you to talk to the trading platform. While voice-activated trading is just starting to be used in the market, you will see that it will become a more popular feature in the years ahead. [ENLISH ONLY]
Free
cTrader Advanced Ichimoku Kinko Hyo
This unique cTrader Ichimoku Kinko Hyo indicator has a built-in risk & reward tool and analyse the markets to generate quality trade signals. Generated signals are sent to your mobile or PC via an instant Telegram message or email.
Partner
cTrader Polynomial Regression Trade Helper
This cTrader Polynomial Regression Channel Auto-Trade Helper is a very useful robot which will automatically open and close the trades for you when the price breaches the middle, inner or outer PRC bands. It has been built to complement your existing trading system using the PRC indicator and works for you when you are away from your computer so you do not need to spend many hours waiting for your trade signals. This uses is a repainting type indicator.
Free
cTrader Risk & Reward Manager
The cTrader Risk & Reward management tool can easily help you to set the risk vs reward values, you can just drag the take profit & stop loss lines to auto calculate the risk amount or volumes needed to be used. Also, included is an automatic take profit feature that will allow you to set four (4) different scenarios to lock in those profits.
Partner


