So, you have an automated trading system that has been built by a professional company like us, it is also working exactly how you imagined, this is only half the job, without the correct parameter settings for each financial instrument it will not perform as well as it could and you could find yourself spending many hours finding the right values.
When you optimise you can choose 1-min bar data which sets the spread as a fixed value or tick data which includes the historical spread, due to the fact that optimising with tick data can take much longer we recommend that you optimise using 1-min bar data until you find suitable parameters and then verify the settings with a backtest using tick data. We discovered that there is not a huge difference between using 1-min bar data and tick data.
Trading Robot Parameter Settings
If you use the wrong parameters with an automated trading system, the back-test and real-time results will be poor, you need the correct parameter settings for the robot to provide a low draw-down and maximum net profit, one method to do this is to optimize the parameters for the current symbol, this is not always required, but we will show you how to tweak the robot for extra performance.
What is Optimisation?
Most trading platforms have an optimization feature, this is where you set the parameters for indicators and your take profit and stop loss to fit the market data, by doing this you are hoping that the future data will also follow these patterns, this will not always be the case as fresh data is unpredictable, but it will increase the probability of winning.
Optimisation Guidelines
If you are new to learning about optimisation then I recommend that you read the article below, it will also explain how far back you should optimise and what parameters are best to curve-fit.
Getting Started
All the Neptune robots we supply are already optimized for the complete date range which at the time was 2011 to 2019, but if you wish to optimize for a different date range or even the past year then we will show you how.
The quickest method to optimise your parameters is to just find the best stop loss and take profits for both buy and sell trades, to do this click on the Automate button on the left of the platform and open the optimisation module in cTrader.
![]()
How to Run a Quick Optimisation
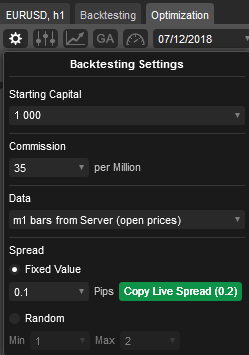
Click on the optimisation tab as shown below and enter your optimisation backtest settings, we used a starting capital of £1000.00, but you can enter anything you want, add the commission for the broker and spread then you are ready to go.
What Is Curve Fitting?
Curve fitting occurs when the strategy parameters are tuned so that they produce optimized results for the specific set of historical data that was tested. Testing over a different date range or with fresh data, the results might be radically different. For example, we might run a test over a period that saw a huge price swing due to a major news event.
A curve fitted strategy may be tuned to capture the maximum profit from those swings thus inflating its overall results. Take away that swing and the same parameters would yield drastically reduced or even negative results. For this reason, we do not believe in optimising all of the trading robot values, especially a stop loss and taking a profit.
How to Optimise
Optimisation means multiple runs of your automated trading robot (cBot) using historical data with different sets of parameters, aimed at finding their best possible combination. During multiple runs, different combinations of the input parameters of the robot are tested to find the parameters to get the highest return on profit with the lowest amount of risk.
What Parameters To Optimise?
If your trading robot uses indicators then you should be able to find the best settings for these indicators, a classic example would be using a Stochastic Indicator to identify when a symbol is oversold or overbought, usually, levels are used which could be 70 for overbought and 30 for oversold, these values will not be the same for all symbols and each symbol will normally have it's own settings as they all have their own personality.
Need Help Optimising?
If you need any help using the optimisation feature of cTrader then please post a message on our support forum for a detailed reply.
Genetic Optimization
If you plan to use the cTraders Genetic Optimisation feature you may wish to understand how it works, the following article below will help you understand. Genetic Optimisation is a heuristic process, it will not have the same result on every execution so when you optimise you will see different results each time.
Optimisation Suddenly Stops
If you notice that during the optimisation runs it shows many hours left to complete, then all of a sudden it stops, this is quite normal and this happens with the Genetic optimisation algorithm as it cannot find any better settings after a number of passes.
Watch a Video Explainer