cTrader Desktop
Over the years we have created many useful trading tools for the cTrader Desktop Trading Platform, we hope you enjoy them.
cTrader CISD Fibonacci Projections Indicator
CISD Fibonacci Projections plots clean bullish and bearish projection targets from live price swings, using a stable fractal swing detector and fixed Fibonacci expansion levels. It scans recent bars to confirm swing highs and swing lows, then waits for a clear break of the prior swing level before creating a new projection. Once triggered, it draws a Fibonacci expansion plus three target lines, labelled 1.0, 1.618, and 2.618. Use it to map realistic continuation targets, manage exits, and standardise take profit planning.
Free
cTrader Candle Range Theory Indicator
The cTrader Candle Theory Range Indicator is a structured price action tool designed to identify accumulation ranges, false breaks, and confirmed directional intent. It automatically maps key levels such as accumulation highs and lows, entry price, stop loss, and take profit directly on the chart. Combining multi-timeframe range analysis with confirmation logic helps traders focus on high-probability setups rather than random price movements. The indicator is suitable for discretionary and systematic traders who want clear visual guidance without overcomplicating their charts.
Free
cTrader Candlestick Timer Indicator
This professional candlestick timer provides an accurate countdown for every forming bar, giving traders precise control over entry timing, breakout confirmation, and intraday decision-making. It displays remaining time, elapsed time, or bar progression as a percentage, and allows placement either on the chart or attached to the current candle. With optional sound alerts and configurable visual settings, it offers a clean and dependable timing tool for scalpers, day traders, and swing traders who rely on precise candle structure.
Free
cTrader Forex Smart Trade Panel
This cTrader Forex Smart Trade Panel cBot provides a fast, controlled way to place and manage manual trades directly from the chart. The modern panel lets you switch between fixed volume and risk per cent, set SL and TP in pips, and see how much of your account is at risk before you click buy or sell. Built-in equity drawdown protection, break-even, and trailing stop management help you enforce consistent risk control on every trade.
£14.99
Excl. VAT
cTrader Trendline Break Momentum Oscillator Indicator
The Trendline Break Momentum Oscillator is a precision tool that converts structural trendline breakout behaviour into a clear momentum signal. It measures the changing distance between bullish and bearish break levels, smooths these values using dual alpha filters and displays them as an oscillator that highlights emerging strength or weakness. Breakout dots, signal-line crossings and divergence markers help traders understand when momentum is building or fading. This tool provides an objective way to confirm price action, identify early trend shifts and support disciplined trade timing.
Free
cTrader Market Structure Oscillator Indicator
The Market Structure Oscillator provides traders with a comprehensive view of market behaviour by analysing structural shifts, breakouts, swing levels, and multi-timeframe momentum in one unified display. It converts raw price movements into a smoothed oscillator that reflects bullish or bearish structure across short, intermediate, and long-term horizons. Additional components, such as swing detection, cycle oscillation, equilibrium cross signals, cloud shading, and optional independent oscillators, give traders advanced tools for anticipating changes in trend character. This is a price action-based market structure momentum oscillator with multi-timeframe structural weighting and cycle analysis.
Free
cTrader Rally Base Drop Indicator
The cTrader Rally Base Drop Indicator is a price action, supply and demand tool that maps institutional-style order flow directly on your chart. It scans each bar, classifies it as Rally, Base, or Drop, and highlights sequences such as Rally Base Drop and Drop Base Rally, which often mark fresh supply and demand zones. Zones are drawn as shaded rectangles and can be filtered to show only the most relevant patterns for your strategy. Flexible bar colouring, sequence toggles, and bullish or bearish icons provide an immediate read on directional momentum, structural pauses, and potential turning points so you can plan entries, stops, and targets with far greater precision.
Free
cTrader Island Reversal Pro Indicator
The cTrader Island Reversal Pro Indicator identifies one of the most decisive price-action reversal structures in modern markets. It automatically locates isolated consolidation blocks that appear after a strong directional leg and before an equally strong breakout in the opposite direction. These patterns signal sudden shifts in sentiment, often marking the early stage of trend reversals or significant pullbacks. The indicator draws shaded zones for both bullish and bearish island formations and adds clear labels so traders can identify turning points with precision. With optional trend, volume, volatility, and horizontality filters, the tool adapts to a wide range of trading styles. It also supports real-time alerts, including Telegram notifications, so traders never miss a key reversal event.
£24.99
Excl. VAT
cTrader Sentiment Dashboard Pro Indicator
The cTrader Sentiment Dashboard Pro Indicator provides a real-time visual summary of market sentiment across multiple symbols in one compact on-chart panel. Traders can switch between a colour-coded heatmap or percentage view, track bullish and bearish sentiment values, and receive instant alerts or Telegram notifications when extreme conditions are detected. This is a Sentiment and Visualisation Indicator.
Free
cTrader Accumulation Heatmap Grid Indicator
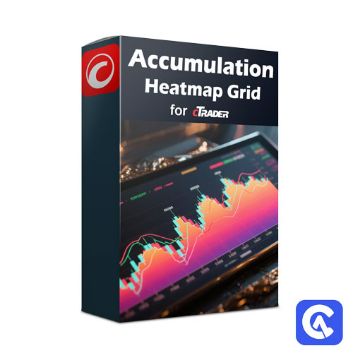
The cTrader Accumulation Heatmap Grid Indicator visualises where price and volume concentrate on your chart. It creates a heatmap of accumulation intensity and displays a percentage grid on the right side, giving traders an instant view of market balance and activity zones. With its built-in dashboard and configurable colour themes, it helps identify support, resistance, and high-interest price levels with precision. This is a volume distribution and market profile indicator, focused on visualising accumulation, value areas, and liquidity concentration zones.
Free
cTrader Standardised Cumulative Delta Indicator
The cTrader Standardised Cumulative Delta Indicator measures and compares the strength of price movements across multiple symbols using normalised delta values. It converts raw candle data into standardised z-scores to track synchronised bullish and bearish pressure. This powerful multi-symbol indicator helps traders identify inter-market sentiment, trend correlation, and momentum alignment in a clean histogram format. This is a statistical sentiment and correlation indicator for cTrader.
Free
cTrader Market Session Flow Indicator
The cTrader Market Session Flow Indicator highlights the directional flow of each trading session using your broker's actual trading hours for each symbol. It visually maps consecutive bullish and bearish sessions, showing streaks, reversals, and probabilities of continuation. A detailed dashboard displays bias statistics, historical performance, and live updates, helping traders interpret market flow and session dynamics with precision.
£14.99
Excl. VAT
cTrader Liquidation Heatmap Indicator
The cTrader Liquidation Heatmap Indicator visualises liquidity concentrations as a live, colour-based heatmap on your chart. It highlights price levels where liquidity may accumulate or dry up, helping traders identify areas of potential liquidation, clustering, and institutional interest. With adjustable lookback periods, colour gradients, and distribution models, it provides an intuitive map of hidden market structure. This is a liquidity visualisation and market structure indicator for cTrader.
£14.99
Excl. VAT
cTrader Linear Weighted Moving Average Indicator
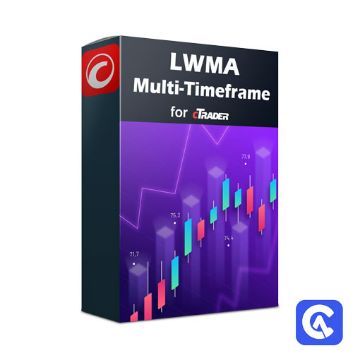
The cTrader Linear Weighted Moving Average Multi-Timeframe (LWMA MTF) Indicator calculates and displays a Linear Weighted Moving Average for both the current chart timeframe and a selectable higher timeframe. It helps traders align short-term price action with long-term trend momentum, offering clearer insight into trend strength and direction across multiple time horizons. This is a trend-following multi-timeframe indicator for cTrader.
Free
cTrader Volume Surprise Indicator
The cTrader Volume Surprise Indicator detects unusual volume activity by comparing the current tick volume against statistically expected values based on historical data. It highlights moments when trading activity spikes beyond normal ranges, helping traders identify institutional participation, hidden accumulation, or potential breakout conditions. It provides optional pop-up alerts and chart arrows. On-chart info panel showing group data and deviation strength.
Free
cTrader Smoothed Double Moving Average
The Smoothed Double Moving Average (SDMA) Indicator for cTrader enhances traditional moving averages by applying double smoothing to reduce noise and reveal clearer market direction. It plots both a smoothed double average and a standard moving average, generating crossover signals that highlight potential trend reversals. With optional pop-up and Telegram alerts, traders can receive instant notifications of key movements without constantly monitoring charts.
Free
cTrader Liquidity Sweep Signal Indicator
The cTrader Liquidity Sweep Indicator detects and highlights price sweeps on both the buy and sell sides of the market. It identifies when liquidity zones are taken out and the price immediately reverses, revealing potential areas of smart money manipulation or exhaustion. With real-time visuals, alerts, and a live statistics panel, this tool helps traders identify high-probability reversal points that are often missed by standard indicators. This is a market structure and reversal-detection indicator designed to visualise liquidity grabs and stop-hunt events on any symbol or timeframe.
Free
cTrader Adaptive Price-Volume Indicator
The cTrader Adaptive Price Volume Indicator combines price movement and tick volume changes into a single adaptive signal line. It dynamically adjusts internal weights to emphasise whichever input—price or volume—is most influential at any moment. Visual threshold lines mark buy and sell crossover points, and optional Telegram or on-screen alerts notify traders when trade conditions are triggered. This is a Volume-Based Momentum Indicator.
Free
cTrader Equity Protector Risk Management
The cTrader Equity Curve Protector cBot automatically monitors your account equity to prevent excessive drawdowns. When your equity falls by a specified percentage from its peak or starting balance, it can close open positions, cancel pending orders, and stop trading activity. This tool helps traders preserve capital and maintain disciplined risk management by enforcing a predefined equity protection threshold.
Free
cTrader Risk & Reward Expert
The cTrader Risk & Reward Expert Indicator is a professional Risk Management & Trade Automation tool that allows visual pre-planning with Automated Trading support, Trade execution with up to 4 dynamic take-profit targets, and Advanced position management features for every situation. This tool is packed full of must-have features for any trader to get every last bit out of each trade.
Partner
cTrader Market Depth Ladder - Volume Overlay
The cTrader Market Depth Ladder displays live order-book liquidity directly on your chart. By overlaying bid and ask ladders with colour-coded rectangles and volume labels, this indicator reveals which side—buyers or sellers—is dominating at any moment. It’s a practical, real-time visualisation of market depth, perfect for traders who rely on order flow and liquidity analysis. This is a market depth and order-flow visualisation indicator, combining volume imbalance, liquidity mapping, and depth-of-market ladder display.
£14.99
Excl. VAT
cTrader Lot Size & Risk Calculator Panel
The cTrader Lot Size & Risk Calculator Panel is a trading utility that allows you to quickly calculate the risk of each trade before execution. By entering your lot size or volume and applying a default stop-loss in pips, the panel instantly displays the percentage of your account equity at risk. Simple Buy and Sell buttons enable traders to open trades directly from the panel with correct position sizing, helping them manage risk consistently and efficiently. Lightweight panel for fast execution.
Free
cTrader Account Equity Protector
The cTrader Account Equity Protector is a safety net for your trading account, designed to enforce daily drawdown limits, per-trade loss caps, and equity floors. It monitors live equity in real-time, closes positions and pending orders upon breach, and can pause trading until a scheduled reset. Keep any strategy on a short leash, reduce tail-risk blowups, and maintain discipline without babysitting charts.
Free
cTrader Smart Break Even Manager
The cTrader Smart Break-Even Manager cBot helps traders protect their profits by automatically adjusting stop losses to breakeven once a trade reaches a predetermined number of pips in profit. It can also add extra pips beyond breakeven to secure gains while reducing risk. Designed for both beginners and experienced traders, this cBot streamlines risk management and automates trade protection. This is a risk management cBot designed to automatically move stop losses to breakeven once a trade reaches a defined profit threshold.
Free
cTrader Advanced MACD Volume Indicator
The Advanced MACD Volume Indicator for cTrader takes the classic MACD and enhances it with volume filters, high and low markers, and visual alerts. By combining momentum analysis with real-time volume changes, it offers traders a clearer picture of bullish and bearish shifts. The result is a more versatile tool for spotting potential entries, exits, and market reversals across all timeframes.
Free
cTrader Telegram Signal Trader
The Telegram Signal Trader cBot for cTrader automatically reads trading instructions from your Telegram messages and executes them as live trades. It can process market orders, pending orders, and custom trade sizes directly from simple chat commands, helping you automate signal-based trading without manually copying trades. Built for traders who follow Telegram signal groups, this tool bridges messaging and execution for seamless trading.
Free
cTrader Time-Of-Day Volume Profile
The cTrader Time-of-Day Volume Profile indicator shows how market participation varies throughout the trading day. By analysing historical intraday volumes, it highlights periods of high and low activity, helping traders identify the most liquid times to enter or exit positions. Customisation options include heatmaps, average volume displays, and session colouring, making this tool adaptable for both intraday traders and longer-term strategies.
Free
cTrader Quantitative Qualitative Estimation
The Quantitative Qualitative Estimation (QQE) indicator for cTrader is a refined momentum tool that transforms the Relative Strength Index (RSI) into a smoother, more reliable signal generator. By combining RSI smoothing, trailing bands, and volatility filters, it highlights trend shifts with clear buy and sell signals. This makes it useful for spotting reversals, trend continuations, and momentum shifts with less noise than raw RSI.
£14.99
Excl. VAT
cTrader Fair Value Gap Indicator (FVG)
The Fair Value Gap indicator for cTrader highlights areas where price skipped over levels without trading, leaving inefficiencies known as Fair Value Gaps. These zones often attract price back for later mitigation. The tool helps traders quickly spot bullish and bearish imbalances, visualise unfilled liquidity areas, and anticipate potential reversal or continuation points in any market. This is a price action and pattern recognition indicator.
£14.99
Excl. VAT
cTrader Triangle Count Oscillator
The Triangle Count Oscillator is a custom-built technical tool for cTrader that identifies repeating triangular patterns formed from swing highs and lows. It automatically draws triangles on the chart when spacing and swing criteria are met, while simultaneously plotting an oscillator line that tracks the count of active patterns. This provides traders with an extra layer of visual and statistical insight into recurring market structures and momentum. The Triangle Count Oscillator is a pattern recognition indicator that blends geometric chart analysis with an oscillator for quantitative confirmation.
Free


