Volume
cTrader volume indicators show how much trading is happening in the markets. It helps traders see if a trend is strong or weak. High volume means strong interest, while low volume can signal uncertainty.
cTrader Island Reversal Pro Indicator
The cTrader Island Reversal Pro Indicator identifies one of the most decisive price-action reversal structures in modern markets. It automatically locates isolated consolidation blocks that appear after a strong directional leg and before an equally strong breakout in the opposite direction. These patterns signal sudden shifts in sentiment, often marking the early stage of trend reversals or significant pullbacks. The indicator draws shaded zones for both bullish and bearish island formations and adds clear labels so traders can identify turning points with precision. With optional trend, volume, volatility, and horizontality filters, the tool adapts to a wide range of trading styles. It also supports real-time alerts, including Telegram notifications, so traders never miss a key reversal event.
£24.99
Excl. VAT
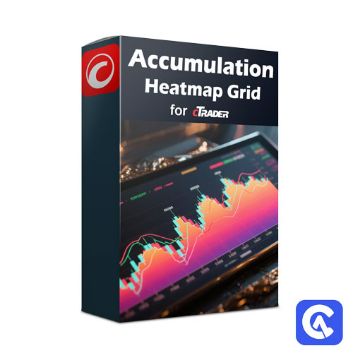
cTrader Accumulation Heatmap Grid Indicator
The cTrader Accumulation Heatmap Grid Indicator visualises where price and volume concentrate on your chart. It creates a heatmap of accumulation intensity and displays a percentage grid on the right side, giving traders an instant view of market balance and activity zones. With its built-in dashboard and configurable colour themes, it helps identify support, resistance, and high-interest price levels with precision. This is a volume distribution and market profile indicator, focused on visualising accumulation, value areas, and liquidity concentration zones.
Free
cTrader Standardised Cumulative Delta Indicator
The cTrader Standardised Cumulative Delta Indicator measures and compares the strength of price movements across multiple symbols using normalised delta values. It converts raw candle data into standardised z-scores to track synchronised bullish and bearish pressure. This powerful multi-symbol indicator helps traders identify inter-market sentiment, trend correlation, and momentum alignment in a clean histogram format. This is a statistical sentiment and correlation indicator for cTrader.
Free
cTrader Market Session Flow Indicator
The cTrader Market Session Flow Indicator highlights the directional flow of each trading session using your broker's actual trading hours for each symbol. It visually maps consecutive bullish and bearish sessions, showing streaks, reversals, and probabilities of continuation. A detailed dashboard displays bias statistics, historical performance, and live updates, helping traders interpret market flow and session dynamics with precision.
£14.99
Excl. VAT
cTrader Liquidation Heatmap Indicator
The cTrader Liquidation Heatmap Indicator visualises liquidity concentrations as a live, colour-based heatmap on your chart. It highlights price levels where liquidity may accumulate or dry up, helping traders identify areas of potential liquidation, clustering, and institutional interest. With adjustable lookback periods, colour gradients, and distribution models, it provides an intuitive map of hidden market structure. This is a liquidity visualisation and market structure indicator for cTrader.
£14.99
Excl. VAT
cTrader Volume Surprise Indicator
The cTrader Volume Surprise Indicator detects unusual volume activity by comparing the current tick volume against statistically expected values based on historical data. It highlights moments when trading activity spikes beyond normal ranges, helping traders identify institutional participation, hidden accumulation, or potential breakout conditions. It provides optional pop-up alerts and chart arrows. On-chart info panel showing group data and deviation strength.
Free
cTrader Adaptive Price-Volume Indicator
The cTrader Adaptive Price Volume Indicator combines price movement and tick volume changes into a single adaptive signal line. It dynamically adjusts internal weights to emphasise whichever input—price or volume—is most influential at any moment. Visual threshold lines mark buy and sell crossover points, and optional Telegram or on-screen alerts notify traders when trade conditions are triggered. This is a Volume-Based Momentum Indicator.
Free
cTrader Price Ladder Indicator
The cTrader Market Depth Ladder displays live order-book liquidity directly on your chart. By overlaying bid and ask ladders with colour-coded rectangles and volume labels, this indicator reveals which side—buyers or sellers—is dominating at any moment. It’s a practical, real-time visualisation of market depth, perfect for traders who rely on order flow and liquidity analysis. This is a market depth and order-flow visualisation indicator, combining volume imbalance, liquidity mapping, and depth-of-market ladder display.
£14.99
Excl. VAT
cTrader Advanced MACD Volume Indicator
The Advanced MACD Volume Indicator for cTrader takes the classic MACD and enhances it with volume filters, high and low markers, and visual alerts. By combining momentum analysis with real-time volume changes, it offers traders a clearer picture of bullish and bearish shifts. The result is a more versatile tool for spotting potential entries, exits, and market reversals across all timeframes.
Free
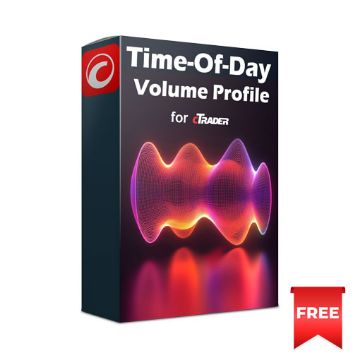
cTrader Time-Of-Day Volume Profile
The cTrader Time-of-Day Volume Profile indicator shows how market participation varies throughout the trading day. By analysing historical intraday volumes, it highlights periods of high and low activity, helping traders identify the most liquid times to enter or exit positions. Customisation options include heatmaps, average volume displays, and session colouring, making this tool adaptable for both intraday traders and longer-term strategies.
Free
cTrader Price Volume Trend
A modified Price Volume Trend that separates rising and falling contributions, plots clean buy and sell markers when direction flips with significance, and shows the last signal label in any chart corner. Built for clarity across symbols and timeframes, with optional pop-up and email alerts for actionable events. It is a volume-weighted momentum and confirmation indicator plotted in a separate pane, with directional signals and alerting.
Free
cTrader Volume Heatmap Indicator
The cTrader Volume Heatmap Overlay colours each bar by recent tick‑volume intensity, revealing participation surges and liquidity droughts directly on price. It scales volume to local percentiles, smooths noise with an EMA, and maps the result to a configurable palette with adjustable transparency. Use it to spot session opens, news bursts, fuelled breakouts, and quiet consolidations without adding extra sub‑windows. A volume‑based visual overlay indicator.
Free
cTrader Enhanced Cumulative Volume Index
The Cumulative Volume Index (CVI) for cTrader is a volume-based breadth indicator which tracks the net flow of volume in or out of a market by cumulatively adding or subtracting volume based on price movement. Ideal for spotting early shifts in institutional sentiment, this free indicator offers traders an edge in volume-based trend analysis.
Free
cTrader Accumulation & Distribution Line Indicator
The cTrader Accumulation & Distribution Line is a popular tool traders use to spot whether a market is under buying or selling pressure. It looks at both price movement and trading volume to show if money is flowing in or out of an asset. When the price rises on strong volume, the line moves up, suggesting accumulation. When the price falls on strong volume, it moves down, pointing to distribution. This makes it especially useful for confirming trends, spotting potential reversals, or noticing when volume doesn't match the price, a clue that something might be about to change.
Free
cTrader Klinger Oscillator
The Klinger Oscillator utilises volume and price movement to indicate when a trend may be strengthening or weakening. It works by comparing two smoothed averages of a volume-based value, often using 34 and 55 periods. Traders use it to spot when momentum may be shifting, especially when the oscillator moves above or below a separate signal line. This can help highlight possible turning points in the market, making it useful for both short-term signals and long-term trend confirmation.
Free
Kecia Footprint Orderflow indicator
This indicator is designed to help traders better understand the market’s actual order flow dynamics. Visualizing the “footprints” left by candles reveals how the delta (the difference between buying and selling pressure) changes during candle formation and how volume fluctuates at different price levels. These insights are essential for traders identifying reversals, breakouts, and key support or resistance zones based on the underlying order flow.
Partner
cTrader Technical Indicator Collection
Now you can download the complete collection of 9 cTrader professional indicators at a discounted price, each of these indicators was created by Starfield Trading who are financial and strategical experts with over 20 years experience trading, they offer new tools for financial market interpretation. Also, included in each indicator are Telegram & Email Alerts, so you never miss a signal.
Free
cTrader Cumulative Delta Volume Alerts
The cTrader Cumulative Multi-Timeframe Delta Volume indicator shows the difference between the Bid & Ask volume, it shows which side of the market participants, the Buyers or Sellers are more active in a certain period. A powerful setting of this indicator is the ability to choose a different timeframe for the delta indicator than is visible on the chart.
Free
Polarized Fractal Efficiency Indicator
The cTrader Polarized Fractal Efficiency indicator is used in trading and technical analysis to measure the efficiency of price movement in a financial market by identifying trends and assessing the strength and sustainability of those trends. It achieves this by contrasting the straight-line distance separating these points with the actual distance that the price covered during that period.
Free
cTrader Volume Gap Indicator
The Volume Gap Indicator is a technical analysis tool used in trading to measure the difference between the buy and sell volume of a security or asset over a particular period. It displays two separate lines representing the estimated average buy and sell volumes, and the gap between them indicates the level of buying or selling pressure in the market.
Free
cTrader Volume Profile Collection
This is a collection of Volume Profile indicators for the cTrader platform, they show each price level volume and by using this method you will be able to tell which price level had the most trading volume and which one had the least trading volume. The strength of this indicator lies in the fact that by combining volume key levels with something like support and resistance trading methods.
Free
cTrader Rex Oscillator
The cTrader Rex Oscillator is a study that estimates market behaviour based on the relationship between the close to the open and high to low prices of the same candle. The theory behind the Rex Oscillator is that a big difference between the high and close on a bar indicates weakness.
Free
cTrader Volume Profile Indicator
When you use the cTrader Volume Profile indicator, you will have a huge advantage with your trading as you will see important price levels that many other traders do not see and you will be able to easily recognise price levels where the largest Price Action is happening. Single profile only.
Free
cTrader VWAP Cloud Indicator
The cTrader volume-weighted average price (VWAP) indicator is used as a benchmark by traders that will give the average price a symbol that has been traded throughout the day which is based on both volume and price. This type of indicator is important because it provides traders with insight into both trends and value. If you are a fan of trading indicators, then this indicator will suit you.
Free
cTrader Weis Wave Volume
This is a Weis Wave volume indicator for the cTrader trading platform. It is based on Richard D. Wyckoff theory. It works in all time periods, range bar and tick bar charts and it can be applied to any market. This indicator takes the volume and organizes it in waves, highlighting the inflexion points as well as the supply & demand.
Free
- 1
- 2


