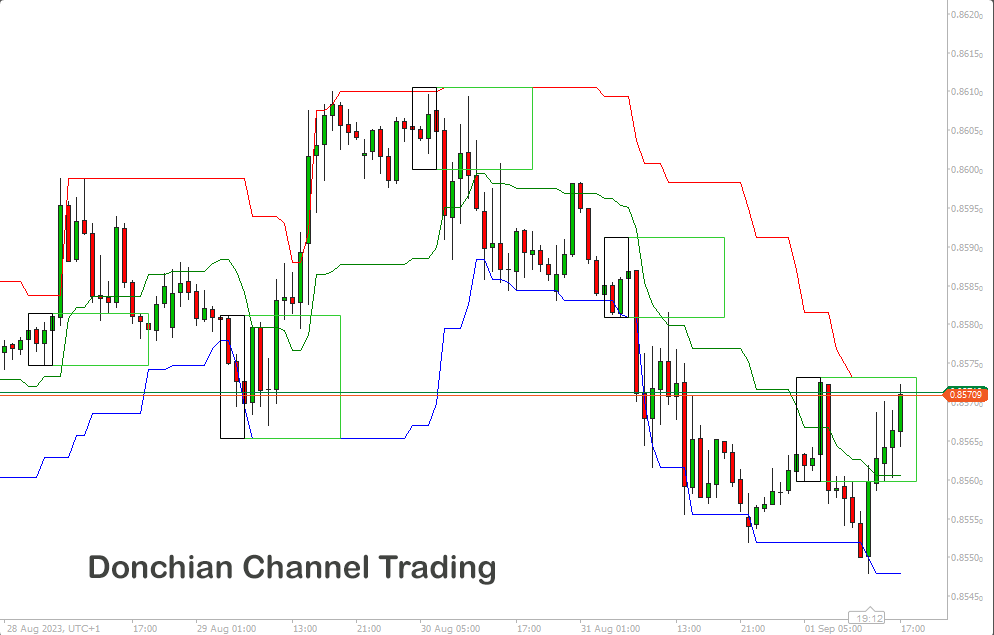
The Donchian Channel is a technical indicator used in technical analysis and trading to help identify potential price breakouts and trends in financial markets. It was developed by Richard Donchian, a prominent figure in the field of technical analysis. This automated strategy uses the indicator to automatically open, close and manage your trades.
Donchian Channel Overview
-
Upper Channel Line - This line represents the highest price level over a specified period, typically a certain number of trading days or periods. It is calculated by finding the highest high within the chosen period.
-
Lower Channel Line - This line represents the lowest price level over the same specified period. It is calculated by finding the lowest low within the chosen period.
- Middle Channel Line - This is a simple moving average (SMA) of the high and low prices over the same specified period. It's essentially the average of the upper and lower channel lines.
How to Trade Using the Donchian Channel
There are various methods to trade using the Donchian Channel indicator, and this strategy opens trades based on the candle's low or high prices breaking pass the indicator's top or bottom price lines, these are known as breakout signals.
Microsoft C# Code Snippet
Bars.LowPrices.Last(1) <= _donchianChannel.Bottom.Last(1) && Bars.LowPrices.Last(2) > _donchianChannel.Bottom.Last(2)
Bars.HighPrices.Last(1) >= _donchianChannel.Top.Last(1) && Bars.HighPrices.Last(2) < _donchianChannel.Top.Last(2)
Breakout Signals
When the current price breaks above the upper channel line, it can be seen as a potential bullish breakout signal and when the price breaks below the lower channel line, it can be considered a potential bearish breakout signal.
Trend Identification
The width of the Donchian Channel can provide an indication of market volatility, When the channels widen it typically indicates higher volatility, but when the channels are narrower it suggests lower volatility. You can use this information to assess the strength and direction of a trend.
Support and Resistance
The Donchian Channel indicator can also be used for potential support and resistance levels, the upper channel line can act as a resistance level, and the lower channel line can be used as a support level.
Keep in mind that no single indicator guarantees profitable trading, and it's essential to use the Donchian Channel in conjunction with other technical and fundamental analysis tools to make informed trading decisions.
Add a Confirmation Indicator
In periods of low volatility, market prices tend to move within a tight range, as indicated by a narrow Donchian Channel and to optimize trading strategies in such ranging markets, traders often employ this indicator in conjunction with oscillators like Stochastics and the Relative Strength Index (RSI), which help identify overbought or oversold market conditions.
Disadvantages of using the Donchian Channel
The drawback of incorporating Donchian channels into a trading strategy is its simplicity and while it's easy to see price breakouts from the upper or lower bounds, on its own it does not show if a new trend is commencing or a potential reversal is looming.
How to Improve this Strategy
There are many ways to improve this cBot, the first one is to add additional indicators for confirmation or additional risk management like market hours, trailing stop losses etc. If you cannot add these extra features yourself contact us.
Stop Loss & Take Profit Calculation
A standard stop loss and take profit as well as position size can be set from the cBots parameter settings.
You can add risk management and other trade rules yourself or by contacting our development team.
How to Optimise the Settings
We have also created a simple video showing how you can find the optimal parameter values, it uses another cBot as an example.
How to Attach Indicator to Chart
You do not need to attach the Donchian Channel indicator to your chart when you run the cBot, but it is a good idea to visually see the indicator to check your trade rules for opening and closing trades and any risk management.
How To View The Source Code
To view the source code for this cBot, you will first need to make sure you have downloaded and installed cTrader Desktop, you can also scroll to the bottom of this page for instructions on how to install the cBot. Once installed you will have the cTrader application open, you need to navigate to the Automate application and click on the name of the cBot, the source should show in the right-hand window.
If you need more help watch a video tutorial on how to use cTrader Automate.
Learn Algorithmic Trading
In this instructional guide, we aim to assist you in acquiring the necessary skills to engage in market trading through automated trading strategies (cBots) using the cTrader Desktop trading platform. By the conclusion of this tutorial, you will gain the confidence to employ a cTrader cBot alongside the Algo application of cTrader, enabling you to automatically execute and handle your market orders. This course is designed to familiarize novice traders with the fundamental principles of algorithmic trading utilizing the cTrader platform.
Learn Microsoft C# for Algo Trading
If you are new to coding your own cTrader cBot for automated trading the following Microsoft C# course will help you modify the starter kit cBot in this download to add new features for your own personal trading strategy.
Algorithmic Trading Facts
A significant number of traders venture into algorithmic trading with the misconception that they have discovered a foolproof strategy that guarantees effortless wealth. However, this notion is far from reality. It is crucial to read this article, as it can save you valuable time and money.
How To Install & Remove
First, make sure you have the cTrader trading platform installed and then simply unzip the file and double-click on it to automatically install it onto the platform.

Any Questions?
If you have any questions, please first search our coding help forum for the answer, if you cannot find it, post a new question.
Need Coding Help?
We can help you modify this cBot for your own personal trading strategy, Contact our team for a quote.
Need a Broker
If you are still looking for a broker you can trust, take a look at our best cTrader broker site.


