The Stochastic oscillator is another technical indicator that helps traders determine where a trend might be ending, these indicators measure the momentum of price. If you imagine a rocket going high up in the sky and before it can return to earth, it must slow down, but the momentum always changes direction before price. This simple momentum oscillator was created by George Lane in the late 1950s.
Theory
- During an uptrend, the historical prices will stay equal to or above the previous period (candle) closing price.
- During a downtrend, the historical prices will usually remain equal to or below the previous periods (candle) closing price.
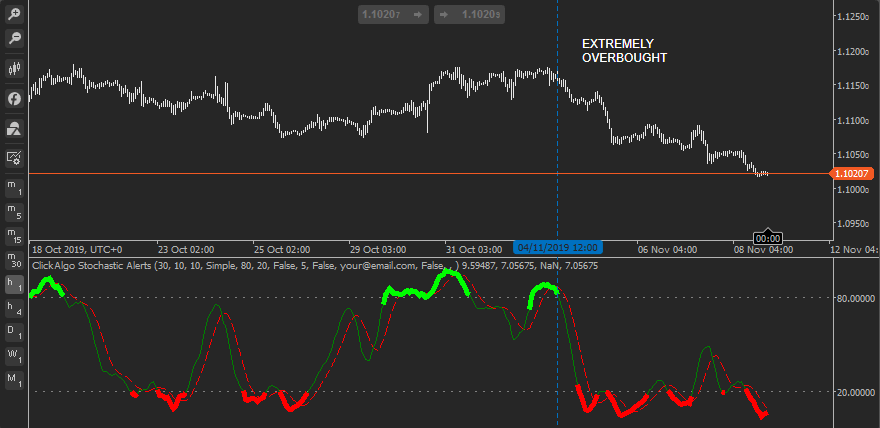
The Stochastic indicator levels are usually scaled from 0 to 100 and when the image below shows one of our advanced stochastic oscillators with levels of 80 and 20, as you can see both the green line and the red dotted line were above the 80 level which denotes that this symbol has been extremely overbought, the price dropped 100 pips to the lower level where again both of the lines were below 20.
This example is for an overbought symbol, but the same would be in reverse for an oversold symbol which is shown below when both the red dotted and green lines dropped below the lower 20 levels. The upper and lower levels are configurable in the indicator and it is up to the trader what value is required for each instrument (symbol) they are trading.
Stochastic Oscillator Indicators
If you wish to download and start trading using a Stochastic Oscillator then you have many options, if you are using the cTrader trading platform you can attach the standard indicator to a chart from the trading platform. If you would like a more advanced version of the Stochastic Oscillator then take a look at the options below.
- cTrader Advanced Stochastic Oscillator Alerts - this will send a pop-up, email or Telegram alert when a symbol is oversold or overbought.
- cTrader Advanced Stochastic Oscillator - this FREE version will show you visually when a symbol is oversold or overbought.