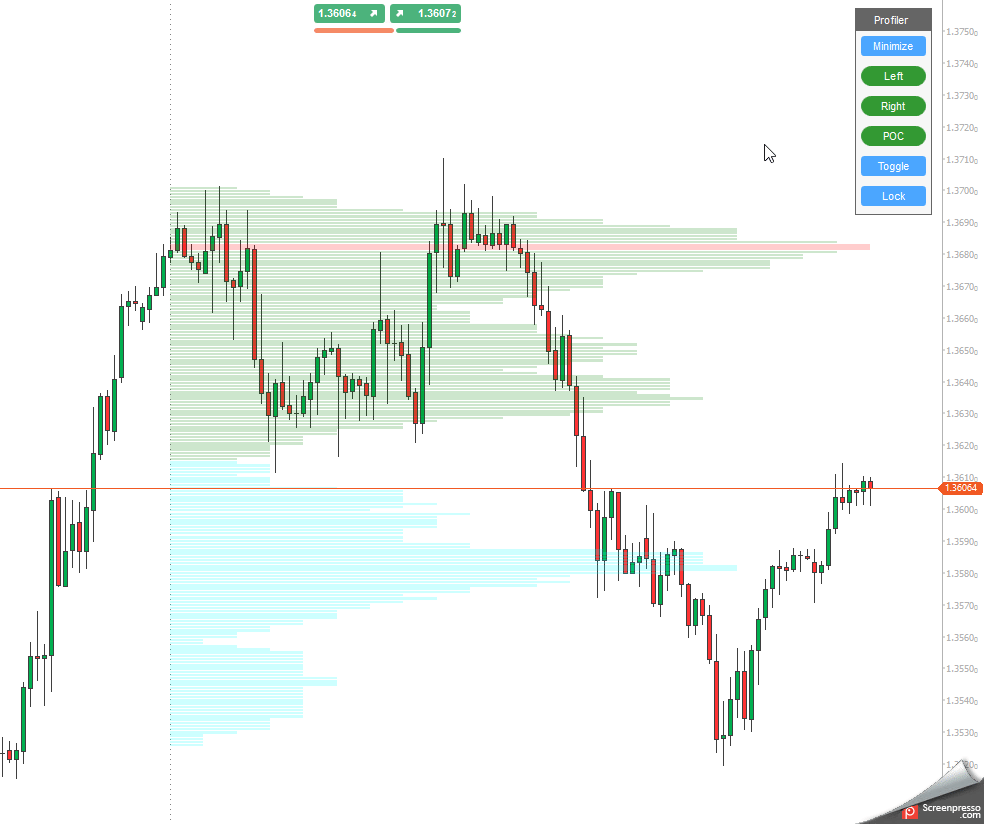
When you open a chart that has the indicator added you will see the indicator settings window with a single adjustable setting called Control Position, it will default to TopLeft, this is where the control panel will be located on the chart, you can choose top or bottom left or right to suit your chart setup.
![]()
Control Panel
When you attach an indicator to a chart you will see a control panel as shown below, you can attach multiple Market Profile indicators to the chart if you want to but a single indicator per chart is all you need.

With this little control panel, you can manage the indicator on the chart with a single click on the mouse.
- Minimize - reduces the size of the panel so you can free up your chart space.
- Left - move the market profile left 1 candle at a time.
- Right - move the market profile right 1 candle at a time.
- POC - option to hide all value-added areas and only show the point of control lines.
- Toggle - switch the market profile view from left to right.
- Lock - this will lock further data updates to the indicator so that you can plan your trading on a historical profile.
