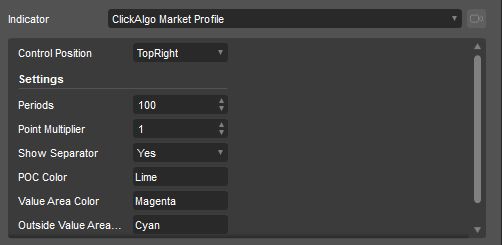
When you first attach the indicator to a chart you will see the settings being displayed in a pop-up as shown below, from this window you can set your core settings for the indicator which is explained in more detail below.
Settings Explained
The first parameter is explained above for positioning the control panel and all the others are as follows:
- Periods - how many periods (bars/candles) in the past should be used for the market profile calculations. on a 1-hour timeframe, 100 periods would be 100 hours of historical data or 4.1 days.
- Point Multiplier - the higher the value the wider the profiles price boxes and the fewer the chart objects (histo-bars) and this is an important setting and uses the pip-size of the symbol so that you can get the best bar object view on the chart.
- Show Separator - this simply shows or hides the dotted vertical line where the market profile starts.
- POC Colour - this is the Point of Control bar colour.
- Value Area Colour - this is the colour of the inside VAC bars.
- Outside Value Area Colour - this is the colour of the outside VAC bars.
- Transparency - this is how much of the background you can see, 255 is a solid coloured profile bar and 0 is completely transparent so no bars are visible, the default setting is 50, but adjust to suit your eyes.
How to Edit Settings Once Indicator is on the Chart
Once the indicator is on the chart it is not very obvious how you can edit the settings.