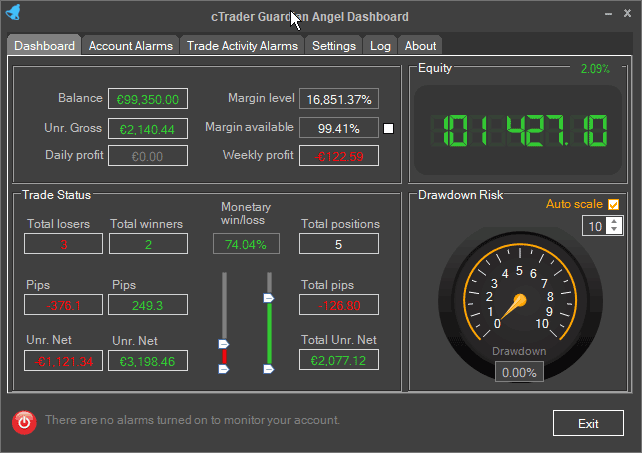
The cTrader Guardian Angel Dashboard window is a very useful screen as it shows your winners, losers, profit targets and how much you are currently risking in your account balance, it is the perfect dashboard for manual or automated traders.

Account Information
This section displays your key risk factors at a glance which shows your current account balance, profits for day and week and your current margin level which is very important so you do not get a margin call.

Balance
This is your current account balance taking into account all closed positions, but not any positions that may already be open.
Margin Level
The Margin Level is the percentage (%) value based on the amount of Equity vs. the Used Margin, this allows you to know how much of your funds are available for new trades. The higher the Margin Level, the more Free Margin you have available to trade.
Margin Available
This is the money in a trading account that is available to the trader and to calculate Free Margin, you must subtract the margin of your open positions from your Equity.
* The checkbox on the right-hand side of the Margin Available box allows you to switch between percentage % or monetary values.
Unrealised (Unr.) Gross
The current Gross profit or loss excluding swaps and commissions in the account currency.
Daily Profit
This is the realised or how much profit you have made today after all the spread and commissions have been taken, this is your pure profit, if you leave the cBot running it will reset on the next day.
Weekly Profit
This is the realised or how much profit you have made this week after all the spread and commissions have been taken, this is your pure profit, if you leave the cBot running it will reset on the weekday. A week starts on Monday when the markets open again.
Equity Information
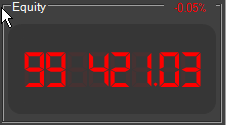
This shows your real account balance if you were to close all your positions, it shows your unrealised equity taking into consideration all your open positions, so if you were to close all your positions this would become your account balance.

The value will show as red when your account equity is less than your actual account balance which means you are losing or green if it is higher which means you are winning. The small percentage value you see top right is the difference between your account balance and the equity, this also shows red or green depending on winning or losing.
Trade Status
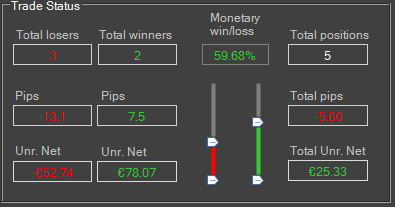
The trade status window will show you important information about your trades that are open and how much profit or loss is occurring.

Trade Losers
This column will show the total number of losing trades, the total number of losing pips and the total amount of unrealised net profit that is currently at risk.
Trade Winners
This column will show the total number of winning trades, total number of winning pips and the total amount of unrealised net profit that is currently in profit.
Monetary Win/Loss
At a glance, you can either visualise the difference between the winner and losers with the slider gauges or with the value shown as a percentage, the picture above shows more trades are winning than losing, but only by 59.68%
Total Positions
How many positions are open, the total number of pips either winning or losing and the total Net unrealised profit if you should close all positions now.
Drawdown Risk
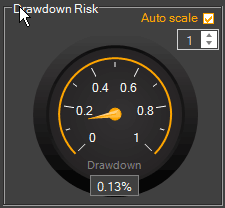
Drawdown is a very important part of trading that many people overlook, this value shows as a percentage how much of your balance you are currently risking and if this value was 50% then half of your balance is at risk of being lost, trading at such high drawdown would be pure gambling or 50/50 with a coin, we suggestion a low-risk drawdown of 5%.

The gauge above shows visually the current drawdown and the box at the bottom shows the number value, you can adjust the gauge to a higher value if you are using shares with the number toggle or you can check the box "Auto Scale" to let the program adjust for you dynamically.