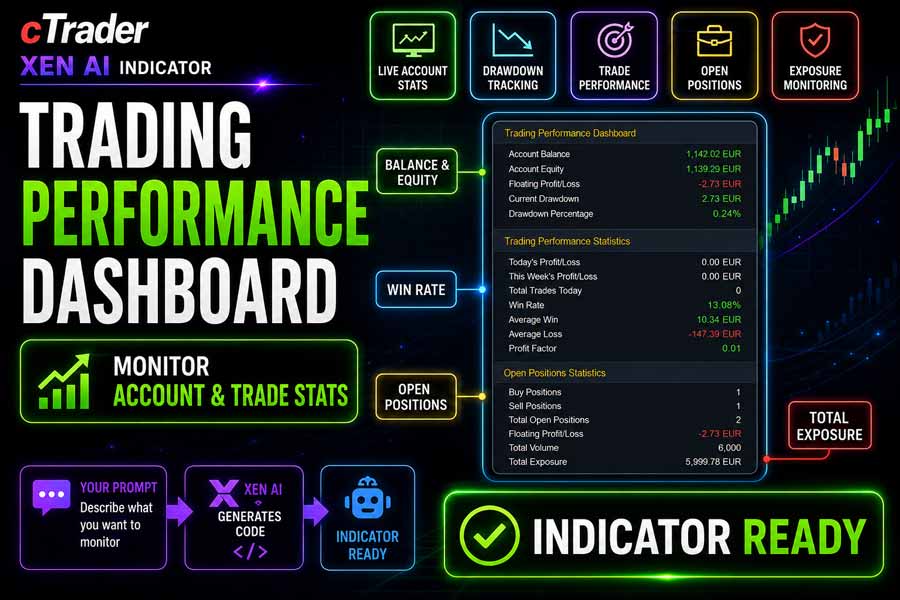
The cTrader Trading Performance Dashboard indicator displays live account, trading performance, and open-position statistics directly on the trading chart. It provides a compact overview of account health, realised trading results, current market exposure, and active positions without requiring traders to switch between multiple platform windows.
The dashboard uses a dark Bloomberg-style interface with colour-coded values. Positive financial values are displayed in green, negative values in red, and neutral statistics in the standard dashboard text colour. The panel can be anchored to any corner of the chart and updates automatically as account values and positions change.
i
Account performance dashboard, live profit-and-loss monitoring, current drawdown measurement, completed-trade statistics, open-position analysis, trading volume monitoring, and account-currency exposure calculation.
Trading Dashboard Overview
Trading performance is often distributed across several areas of the cTrader platform. Account balance and equity appear in one location, completed trades appear in the history tab, and open positions must be reviewed separately. This can make it difficult to quickly get an overview of the account while actively trading.
The Trading Performance Dashboard brings the most useful account and trading statistics together in a single chart panel. It is intended for discretionary traders, account managers, and strategy operators who need to monitor current account conditions without leaving the chart.
The dashboard focuses on three areas: current account health, historical trading performance, and active market exposure.
How the Dashboard Works
The indicator reads live account information, the available completed-trade history, and all currently open positions. It then calculates the relevant statistics and displays them inside three dashboard sections.
Account values and open-position statistics are refreshed as the latest chart data updates. Historical trading statistics are recalculated when the completed-trade history changes or when a new calendar day begins.
Daily and weekly calculations use the indicator time zone, which is configured as UTC. Weekly results begin at Monday 00:00 UTC and continue to the current server time.
Key Features
The Trading Performance Dashboard provides a consolidated view of the account directly from the trading chart.
- Displays live account balance and equity.
- Shows combined unrealised profit or loss across all open positions.
- Calculates current drawdown in account currency.
- Calculates current drawdown as a percentage of account balance.
- Displays today's completed-trade profit or loss.
- Displays the current week's completed-trade profit or loss.
- Counts completed trades from the current calendar day.
- Calculates historical win rate.
- Calculates average winning and losing trade values.
- Calculates profit factor from completed trades.
- Counts open buy and sell positions.
- Displays total open position volume.
- Calculates gross market exposure in the account deposit currency.
- Supports four chart anchoring positions.
- Uses configurable dashboard font sizing.
- Uses colour-coded positive, negative, and neutral values.
- Works across all symbols and timeframes supported by cTrader.
Account Information
The first section provides a live overview of the current trading account.
- Account Balance: The current account balance excluding unrealised open-position profit or loss.
- Account Equity: The current account value including unrealised open-position profit or loss.
- Floating Profit/Loss: The combined unrealised net profit or loss across all currently open positions.
- Current Drawdown: The difference between account balance and equity when equity is below balance.
- Drawdown Percentage: The current drawdown expressed as a percentage of account balance.
When account equity is equal to or greater than account balance, current drawdown is displayed as zero.
Trading Performance Statistics
The second section analyses completed trades from the cTrader account history. Open positions are excluded from these calculations.
- Today's Profit/Loss: Combined net profit or loss from trades completed during the current UTC calendar day.
- This Week's Profit/Loss: Combined net profit or loss from trades completed since Monday 00:00 UTC.
- Total Trades Today: Number of trades completed during the current UTC calendar day.
- Win Rate: Percentage of all available completed trades with a positive net profit.
- Average Win: Average net profit of all winning completed trades.
- Average Loss: Average net result of all losing completed trades.
- Profit Factor: Gross profit divided by the absolute value of gross loss.
When the account has profitable trades but no losing trades, profit factor is displayed as an infinity symbol.
Open Positions Statistics
The third section provides a real-time overview of all active positions across the trading account.
- Buy Positions: Number of currently open buy positions.
- Sell Positions: Number of currently open sell positions.
- Total Open Positions: Combined number of open buy and sell positions.
- Floating Profit/Loss: Combined unrealised net profit or loss across all open positions.
- Total Volume: Combined volume in units across all open positions.
- Total Exposure: Gross notional value of all open positions converted into the account deposit currency.
Exposure is calculated using the absolute notional value of each position. Buy and sell exposure are not offset against each other, providing a gross measurement of the total capital exposed to market movement.
How to Use it for Trading
The dashboard can be used as a continuous account-monitoring tool while trading manually, operating automated systems, or supervising several open positions.
Traders can use account equity and drawdown values to identify when current open losses are becoming excessive. Today's and this week's profit or loss can help enforce daily or weekly risk limits. Win rate, average win, average loss, and profit factor provide a broader view of historical trading performance.
The open-position section can be used to monitor directional concentration, total trading volume, floating profit or loss, and gross account exposure. This is particularly useful when several symbols or strategies are running simultaneously.
The dashboard is an analytical and monitoring tool. It does not place trades, close positions, modify orders, or enforce risk limits automatically.
Complementary Trading Tools
The Trading Performance Dashboard works well alongside tools that provide position sizing, risk control, trade management, and market analysis.
- Position Size Calculators, to calculate suitable trade volume before entry.
- Account Equity Protectors, to automatically close trades at predefined account limits.
- Break-Even Managers, to protect profitable open positions.
- Trailing Stop Managers, to manage stop losses as trades move into profit.
- Risk and Reward tools, to plan stop-loss and take-profit levels.
- Economic Calendar indicators, to monitor upcoming market events.
- Market Session indicators, to identify active global trading sessions.
Inputs & Parameters
The dashboard includes settings for chart placement and text size.
| Parameter |
Default/Type |
Description |
| Visual Design |
|
Controls dashboard placement and text size. |
| Dashboard Anchor |
Top Right, enum |
Positions the dashboard at the Top Left, Top Right, Bottom Left, or Bottom Right of the chart. |
| Font Size |
11, int |
Controls the text size used throughout the dashboard. Supported values range from 8 to 30. |
Calculation Logic
The dashboard uses live account information, completed-trade history, and open-position data supplied by cTrader.
Floating Profit/Loss
Adds the net profit or loss of every currently open position.
Current Drawdown
Subtracts account equity from account balance when equity is below balance. If equity is equal to or above balance, drawdown is zero.
Drawdown Percentage
Divides current drawdown by account balance and multiplies the result by 100.
Daily Performance
Adds the net result of trades closed from the beginning of the current UTC calendar day.
Weekly Performance
Adds the net result of trades closed from Monday 00:00 UTC to the current time.
Win Rate
Divides the number of profitable completed trades by the total number of completed trades and converts the result into a percentage.
Average Win and Average Loss
Calculates the average net result of profitable trades and the average net result of losing trades separately.
Profit Factor
Divides total gross profit by the absolute value of total gross loss.
Gross Position Exposure
Multiplies each position's volume in units by its current price, converts the resulting quote-currency notional value into the account deposit currency, and adds the absolute values together.
Advantages
The dashboard consolidates important account, historical-performance, and open-position information into one compact chart panel. This allows traders to review account health and market exposure quickly without repeatedly switching between different cTrader tabs.
Disadvantages
The dashboard is a monitoring tool and does not automatically control risk or prevent trading losses. Historical statistics depend on the completed-trade history available inside cTrader, and the results should not be treated as a prediction of future trading performance.
Important Information
The dashboard calculates daily and weekly results using UTC. Traders whose reporting day is based on another time zone should account for the difference when reviewing today's or this week's performance.
Total volume is displayed in position volume units. Total exposure is displayed in the account deposit currency and represents gross exposure without offsetting buy positions against sell positions.
The dashboard does not provide financial advice, trade signals, or automated risk protection. Always verify account information directly within the cTrader platform before making trading decisions.
How To Install & Remove
First, ensure that the cTrader trading platform is installed. Unzip the downloaded file if required, then double-click the indicator file to install it automatically in cTrader.
Built with Xen AI
This cTrader Trading Performance Dashboard was created using Xen AI, the AI coding assistant from ClickAlgo, to build cTrader indicators, cBots, plugins, dashboards, and trading tools from plain English prompts.
The dashboard was developed iteratively, beginning with the visual interface and then adding live account information, completed-trade performance statistics, and open-position exposure analysis.
New users can start with free credits and test Xen AI before upgrading. Learn more about Xen AI free credits.