Charting & Analysis
cTrader Charting tools give traders a graphical view of price action, trends, and key market levels. They can include indicators, drawing tools, and customizable timeframes to analyze support, resistance, momentum, and volume; most traders rely on them for technical analysis, trade planning, and risk management.
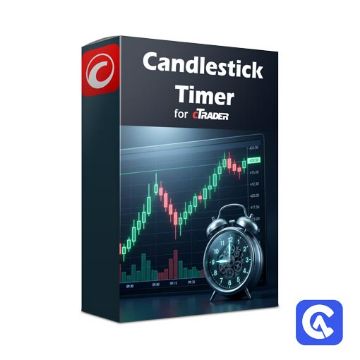
cTrader Candlestick Timer Indicator
This professional candlestick timer provides an accurate countdown for every forming bar, giving traders precise control over entry timing, breakout confirmation, and intraday decision-making. It displays remaining time, elapsed time, or bar progression as a percentage, and allows placement either on the chart or attached to the current candle. With optional sound alerts and configurable visual settings, it offers a clean and dependable timing tool for scalpers, day traders, and swing traders who rely on precise candle structure.
Free
cTrader Market Session Flow Indicator
The cTrader Market Session Flow Indicator highlights the directional flow of each trading session using your broker's actual trading hours for each symbol. It visually maps consecutive bullish and bearish sessions, showing streaks, reversals, and probabilities of continuation. A detailed dashboard displays bias statistics, historical performance, and live updates, helping traders interpret market flow and session dynamics with precision.
£14.99
Excl. VAT
cTrader Liquidation Heatmap Indicator
The cTrader Liquidation Heatmap Indicator visualises liquidity concentrations as a live, colour-based heatmap on your chart. It highlights price levels where liquidity may accumulate or dry up, helping traders identify areas of potential liquidation, clustering, and institutional interest. With adjustable lookback periods, colour gradients, and distribution models, it provides an intuitive map of hidden market structure. This is a liquidity visualisation and market structure indicator for cTrader.
£14.99
Excl. VAT
cTrader Price Ladder Indicator
The cTrader Market Depth Ladder displays live order-book liquidity directly on your chart. By overlaying bid and ask ladders with colour-coded rectangles and volume labels, this indicator reveals which side—buyers or sellers—is dominating at any moment. It’s a practical, real-time visualisation of market depth, perfect for traders who rely on order flow and liquidity analysis. This is a market depth and order-flow visualisation indicator, combining volume imbalance, liquidity mapping, and depth-of-market ladder display.
£14.99
Excl. VAT
cTrader Market Status Dashboard
The cTrader Starfield Trading is an excellent technical indicator that provides a lot of useful information about market volatility, the trend direction, trend continuation, market consolidation and upcoming volatility breakouts. Now you can see what is happening in the markets with Telegram & Email Alerts.
£19.99
Excl. VAT
cTrader Market Trading Signals
This cTrader Forex Market Signals indicator by Starfield Trading is derived from Dynamic RSI, Bollinger bands and trend signal to provide the perfect signals for manual trading or even to incorporate into an automated trading system. Telegram & Email Alerts, so you never miss a signal.
£14.99
Excl. VAT
Fractal Graph Dimension (FGD)
The Fractal Graph Dimension (FGD) Indicator for cTrader offers significant benefits, chiefly automating chart analysis and generating signals based on this analysis & this automation empowers traders to make well-informed decisions by plotting a graph. The FGD Indicator visually presents the currency pair's price movements and the corresponding fractals within that specific timeframe providing a comprehensive view to better understand the market dynamics at any particular moment.
Free
Financial Analytical Tools
The Free Financial Analytical Application for Windows provides the best TradingView widgets displayed on your screen for market analysis, it includes a powerful Advanced Real-Time Chart for trade setups, a Forex and Crypto Market Screener, Economic Calendar, Technical Analysis for major Forex pairs, HeatMap and a CrossRate screen. Also included is quick access to Position size & Risk of Ruin Calculators.
Free
cTrader Auto Confluence Tools
This cTrader Auto Confluence Tool kit comprises of 3 special indicators that automatically chart support and resistance, trend lines, and Fibonacci retracements based on a supplied time frame. This allows a trader to view all indicators of multiple timeframes on a single chart.
Partner
cTrader Symbol Overlay
The cTrader symbol overlay or watermark indicator will display the symbol name, timeframe and other information on the chart. It is very useful for switching charts and seeing which symbol is being traded.
Free
cTrader Chart Pagination Indicator
The cTrader Chart paginator indicator will easily allow you to quickly view the charts by stepping left or right on timeframes for Daily, Monthly and Yearly, traders have found this very useful for fast chart analysis.Full source code included.
Free
cTrader Chart Auto Zoom
This is an excellent cTrader indicator created by a developer called Devman that will automatically change the timeframe as you zoom in or out of the chart with the option to set the time, tick, Renko and Range order. Full source code included.
Free
cTrader Advanced Ichimoku Kinko Hyo
This unique cTrader Ichimoku Kinko Hyo indicator has a built-in risk & reward tool and analyse the markets to generate quality trade signals. Generated signals are sent to your mobile or PC via an instant Telegram message or email.
Partner
cTrader Chart Drawing Synchroniser
This Free cTrader Chart Drawing Synchroniser tool by Spotware will automatically add your technical drawings quickly across all your open charts. Traders will find it useful when they are adding technical drawings for planning trades and would also like to see the same drawings on other charts with different timeframes.
Free
cTrader Chart Sync Zoom Indicator
The cTrader Chart Zoom indicator allows you to zoom in and out on all open charts at the same time without having to do it individually, this is a great tool for multi-timeframe chart zooming. You will need to attach the indicator to each of the charts that you wish to have synchronised zooming.
Free
cTrader Automated Drawing Tool
This indicator for the cTrader platform will automatically draw Fibonacci Retracement levels, support & resistance and trend lines based on a pre-selected area on the chart, this is very useful for new traders who are unfamiliar with using these trading tools.
Free
cTrader Symbol & Period Control Panel
This is an excellent cTrader indicator created by a developer called Bart that allows you to quickly change the chart timeframe or symbol you wish to trade by clicking on a button on the chart. It also has to ability to customise the quick click buttons from symbols on your symbol watchlist.
Free
cTrader Measure Charting Tool
The measuring tool indicator was created by Spotware and is not available as standard with the cTrader platform, so this was created to duplicate some of the features of the popular measure tool used in TradingView. The following data is made available as you draw on the chart bars, amount of time, price delta, price percentage change, and volume.
Free
cTrader Chart Navigation Tool
The Chart Navigation Indicator for the cTrader trading platform allows you to quickly switch timeframes or symbols by pressing keyboard arrow keys, it works simultaneously across all your open cTrader charts. If you are a scalper of need to quickly open or manage your trades then this tool is one you should have in your toolkit.
Free
cTrader Free Harmonic Scanner
The Free cTrader harmonic indicator is a feature-limited copy of the full-paid version that uses Fibonacci numbers to define precise turning points in the Forex markets to predict future movements. This indicator contains the following patterns: Gartley & Crab. When you use Harmonic patterns for trading, it refers to the idea that trends are harmonic phenomena, which means they can be subdivided into smaller or larger waves that could predict the price direction.
Free
cTrader Chart Drawing Saving Tool
Many traders have requested a way of saving all chart drawing objects so that it loads automatically when cTrader is opened again, this Chart Drawing Object Saving Tool will quickly do this for you. It is also possible to load and save all the drawings on the chart using the keyboard hotkey shortcuts.
Free
cTrader Chart Pattern Drawing Tool
This is one of the most popular drawing tools for cTrader that is open source, you can draw Head & Shoulders, ABCD, GANN, Fibonacci, Pitchfork and many other major patterns onto your chart. It is fully customisable so that you can draw the patterns with any colour scheme that suits you, this tool does not automatically find the patterns, you will need a good understanding of how to draw them onto your charts.
Free
cTrader Crosshair Synchroniser
The cTrader Crosshair Synchroniser indicator allows you to move the crosshair on your working chart symbol and see it move on your other charts for the same symbol using the same or different timeframes by syncing all charts together.
UPDATE April 2022:
New improved update, no lagging or freezing.
UPDATE April 2022:
New improved update, no lagging or freezing.
Free
cTrader Web Screener Widget
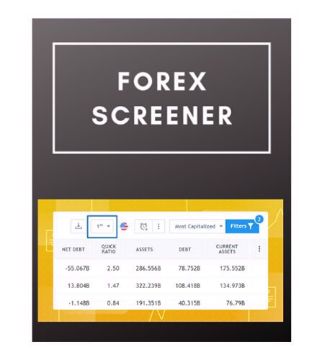
The purpose of the Forex Screener is to allow you to filter instruments based on fundamental data and various technical indicators, this tool offers custom filters on the data columns and lets you change display modes by selecting either a symbol list or a toolbar mode.
Free
cTrader Cross-Rate Web Widget
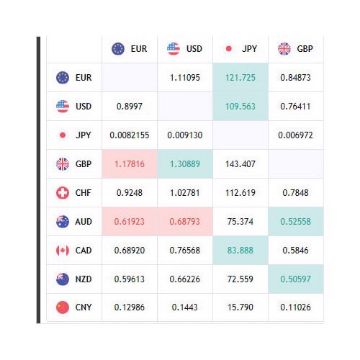
The purpose of the Forex Cross-rates web widget is to allow you to display real-time quotes of all the major currencies in comparison to the other major currencies at a glance.
Free
- 1
- 2

