Indicator Overview
The cTrader Sentiment Dashboard Indicator displays real-time market sentiment for multiple instruments in one clear dashboard. It shows buy and sell percentages or a heatmap of bullish, bearish, and neutral bias, helping traders instantly gauge overall market mood. The dashboard updates automatically and can trigger alerts or Telegram notifications when sentiment reaches extreme levels. By combining visual clarity with live data, it helps traders identify crowd behaviour, confirm market direction, and avoid trades during overextended conditions.
i
The Sentiment Dashboard Pro stands out by merging data precision with visual clarity. It transforms live market sentiment into an intuitive dashboard that tracks multiple pairs simultaneously. Traders can instantly spot shifts in crowd bias, confirm strength behind price moves, and receive alerts when sentiment becomes extreme. Whether viewed as a heatmap or a percentage display, it delivers a fast, data-driven edge for reading market psychology and anticipating turning points before they appear on the chart.
Background & History
Sentiment dashboards were originally developed for institutional desks to track crowd positioning. This cTrader version extends that idea by integrating Spotware's sentiment feed directly into a live visual display, allowing traders to interpret aggregated market psychology alongside price action.
How the Indicator Works
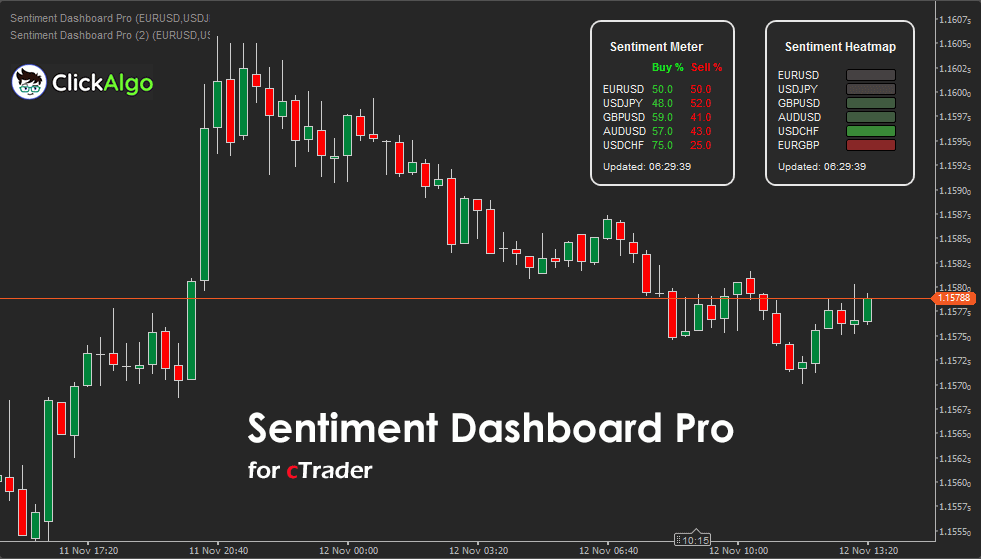
The cTrader Sentiment Dashboard Pro Indicator analyses live trader positioning data from the cTrader platform. It measures the percentage of buy and sell orders for each selected instrument, revealing whether the market is leaning more towards bullish or bearish sentiment. This data is updated in real time, allowing traders to see how crowd behaviour changes throughout the day. The indicator can display information in two modes. In Percent Mode, it shows exact buy and sell percentages for each symbol. In Heatmap Mode, it uses colour gradients to illustrate intensity: green indicates bullish bias, red indicates bearish pressure, and grey indicates neutrality. When sentiment across multiple instruments becomes extreme, such as over ninety percent bullish or bearish, the indicator highlights this imbalance and can trigger optional alerts or Telegram notifications. It displays everything on a floating, movable dashboard that keeps traders constantly aware of the overall market mood.
Key Features
The cTrader Sentiment Dashboard Pro Indicator provides a real-time view of trader positioning across multiple instruments, combining visual clarity with powerful alerting tools. It helps traders instantly assess overall market bias and detect potential turning points.
-
Real-time buy and sell sentiment tracking for multiple symbols.
-
Two display modes: percentage or colour-coded heatmap.
-
Extreme sentiment alerts via on-screen popups or Telegram notifications.
-
Customisable dashboard position, size, and colour scheme.
-
Continuous automatic updates for live market awareness.
This tool offers an efficient way to monitor market psychology and sentiment shifts.
How to Use it for Trading
Use the cTrader Sentiment Dashboard Pro Indicator as a fast market read, then act only when sentiment aligns with your plan.
-
Start by adding three to six symbols you actually trade, and watch the dashboard for clusters of green or red across several pairs.
-
Bullish conditions mean buy percentage is greater than sell percentage across multiple symbols, look for broad green with rising values, which suggests crowd support and continuation potential.
-
Bearish conditions mean sell percentage dominates across several symbols, broad red with rising values suggests downside pressure and possible continuation.
-
Extremes near your threshold — such as 90%—often precede exhaustion; treat these as areas to tighten stops, scale out, or wait for a pullback.
-
Confirm direction with a trend filter, such as LWMA or SDMA, on a higher timeframe. Only take longs when the filter is up and sentiment is green, only take shorts when the filter is down and sentiment is red.
-
Add risk controls, use ATR for stop distance, cap risk per trade, and avoid entering just before major news when sentiment can flip.
-
For beginners, paper trade first, note how sentiment clusters behave during London and New York, then add small position sizes once you can link sentiment shifts to clean price action.
Telegram Alerts
When a signal occurs, the indicator will send a Telegram alert directly to your PC or mobile device.
Complimentary Indicators
For best accuracy, use with:
-
Volume Surprise Indicator for volume anomalies supporting sentiment extremes.
-
Standardised Cumulative Delta for cross-market flow confirmation.
-
Smart Break-Even Manager cBot to automate exits when sentiment reverses.
Inputs & Parameters
The Sentiment Dashboard Pro offers flexible configuration for dashboard layout, colour scheme, and alert management.
| Parameter |
Default/Type |
Description |
| Symbols |
EURUSD,USDJPY,GBPUSD,AUDUSD,USDCHF |
Comma separated list of instruments to display in the dashboard. |
| Dashboard View |
Heatmap (enum) |
Selects display style between Heatmap or Percent view. |
| Dashboard Corner |
TopRight (enum) |
Positions the dashboard in the chosen chart corner. |
| Corner Offset X/Y |
20 (int) |
Offsets dashboard position from chart edges. |
| Accent Color |
#FFE7E7E7 (Color) |
Text and border colour for labels and titles. |
| Background Color |
#292929 (string) |
Main background colour of the dashboard panel. |
| Bullish Color |
LimeGreen (Color) |
Colour used for bullish sentiment representation. |
| Bearish Color |
Red (Color) |
Colour used for bearish sentiment representation. |
| Neutral Color |
#444444 (Color) |
Colour used when sentiment is balanced or neutral. |
| Extreme Sentiment Threshold |
90 (double) |
Threshold percentage for triggering extreme sentiment alerts. |
| Enable Alerts |
True (bool) |
Activates popup alerts when all symbols exceed threshold. |
| Send Telegram Alert |
False (bool) |
Enables Telegram alerts when configured with bot credentials. |
| Telegram Bot Token / Chat ID |
(string) |
Used to send Telegram notifications when alerts trigger. |
Formula Explanation
This indicator displays aggregated market sentiment from cTrader’s sentiment feed. Buy and sell values are expressed as percentages.
Sentiment % = (Buy Orders ÷ (Buy Orders + Sell Orders)) × 100
Advantages
It gives traders a fast and visual way to understand market bias across multiple instruments at once. It saves time by replacing manual sentiment checks with a clear on-chart summary. Real-time updates help identify when crowd positioning reaches extremes, which often precedes reversals or breakouts. The ability to switch between numeric and heatmap modes makes it useful for both analytical and visual traders, while built-in alerts and Telegram notifications ensure you never miss key sentiment shifts.
Disadvantages
The main limitation is that sentiment data reflects existing trader positions, not future market intent. This means extreme readings can sometimes appear just before reversals, leading to false assumptions if used alone. It also depends on cTrader’s sentiment feed, which may differ from broader market data. Beginners might misinterpret strong consensus as a signal to enter, when in fact it can indicate exhaustion. For best results, it should be combined with price action, trend filters, or volume-based indicators.
How To Install & Remove
First, ensure the cTrader trading platform is installed. Then unzip the file and double-click it to install automatically.
Need Extra Help?
Get instant answers with cTrader Sensei — our free AI assistant built for the cTrader platform. It can explain the indicator settings, suggest trading strategies, and guide you step-by-step in using this indicator. Rated 4.9 out of 5 in the ChatGPT Store.
Chat with cTrader Sensei.
Prefer human help? Visit our support forum where our team and community can assist you.


