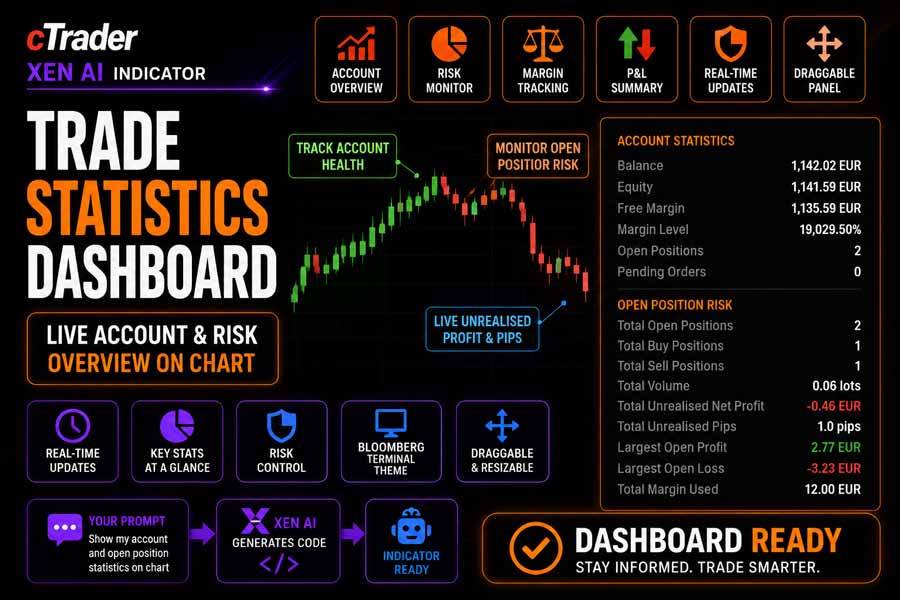
The cTrader Trade Statistics Dashboard displays key account and open position risk statistics directly on the trading chart. It gives traders a clear, real-time overview of account balance, equity, margin, open positions, pending orders, unrealised profit, pip exposure, volume, and margin usage.
The dashboard uses a Bloomberg-style dark terminal theme with high-contrast values, orange section headers, and colour-coded profit and loss values. It is designed for traders who want fast account visibility without switching between different cTrader panels.
i
cTrader account dashboard, trading statistics panel, open position risk monitor, unrealised profit dashboard, margin usage display, draggable chart dashboard, and trading account overview tool.
Background & Purpose
Active traders often need to monitor account exposure while managing open positions. Standard platform panels can show this information, but they are not always visible when focusing on chart analysis. This dashboard solves that problem by placing important trading statistics directly on the chart.
The Trade Statistics Dashboard is especially useful for traders who manage multiple positions, monitor total risk exposure, or need a quick summary of account health before opening or closing trades.
Instead of acting as a signal indicator, this tool works as a visual account and risk monitor. It helps traders stay aware of live account status and open position exposure while trading.
How the Dashboard Works
The dashboard reads live account and position data from cTrader and displays it in two main sections: Account Statistics and Open Position Risk.
The Account Statistics section shows balance, equity, free margin, margin level, open positions, and pending orders. The Open Position Risk section calculates totals from all currently open positions, including buy and sell counts, total volume, unrealised net profit, unrealised pips, largest open profit, largest open loss, and total margin used.
The dashboard updates when positions are opened, closed, or modified, and when pending orders are created, cancelled, or filled. The panel is also draggable, allowing it to be moved around the chart.
Key Features
The Trade Statistics Dashboard provides a compact visual summary of account condition and open trade exposure.
- Displays live account balance, equity, and free margin.
- Shows margin level, open positions, and pending orders.
- Calculates total open buy and sell positions.
- Displays total open trade volume in lots.
- Shows total unrealised net profit.
- Shows total unrealised pips across open positions.
- Highlights largest open profit and largest open loss.
- Displays total margin used by open positions.
- Uses colour-coded profit and loss values.
- Includes a draggable chart panel.
- Uses a dark Bloomberg-style terminal theme.
- Allows font size and opacity adjustment.
How to Use it for Trading
Attach the dashboard to a cTrader chart to display real-time account and position statistics. The panel can be dragged to a suitable location on the chart so it does not interfere with price action, indicators, or drawing tools.
Use the Account Statistics section to monitor available margin, equity movement, and overall account condition. Use the Open Position Risk section to monitor total exposure, current unrealised profit or loss, and whether open trades are concentrated on the buy side or sell side.
The dashboard does not generate trade signals or make trading decisions. It is designed to improve visibility, risk awareness, and account monitoring while trading manually or managing open positions.
Typical Use Cases
- Monitoring open position exposure directly on the chart.
- Checking account equity and free margin before entering new trades.
- Tracking total unrealised profit or loss across all open positions.
- Reviewing total buy and sell position counts.
- Keeping margin usage visible during active trading.
- Managing multiple open positions more safely.
Inputs & Parameters
Use these settings to adjust the visual layout of the dashboard.
| Parameter |
Default/Type |
Description |
| Layout |
|
Controls dashboard text size. |
| Font Size |
12, int |
Adjusts the size of dashboard labels, section headers, and values. |
| Appearance |
|
Controls dashboard visibility and transparency. |
| Opacity |
0.95, double |
Adjusts the transparency of the dashboard background. |
Dashboard Statistics Explained
The dashboard separates account condition from open position exposure so traders can quickly understand both areas.
Balance
Shows the current account balance excluding unrealised open position profit or loss.
Equity
Shows account balance adjusted by current unrealised profit or loss.
Free Margin
Shows available margin that can be used for new positions.
Margin Level
Shows the relationship between equity and used margin as a percentage.
Open Position Risk
Summarises open position count, buy and sell exposure, total volume, unrealised profit, unrealised pips, largest profit, largest loss, and total margin used.
Advantages
The dashboard keeps important account and open position information visible directly on the chart. This can help traders monitor exposure, margin usage, and unrealised profit or loss without switching between platform panels.
Disadvantages
The dashboard is not a trading system and does not provide entry or exit signals. It displays current account and position statistics only, so traders must still use their own strategy, risk rules, and trade management process.
How To Install & Remove
First, ensure the cTrader trading platform is installed. Then unzip the file and double-click it to install automatically.
Built with Xen AI
This cTrader Trade Statistics Dashboard was created using Xen AI, the AI coding assistant from ClickAlgo, to build cTrader indicators, cBots, plugins, dashboards, and trading tools from plain English prompts.
Xen AI can help traders and developers create custom dashboards, trading panels, risk tools, indicators, and automated trading systems for cTrader.
New users can start with free credits and test Xen AI before upgrading. Learn more about Xen AI free credits.


