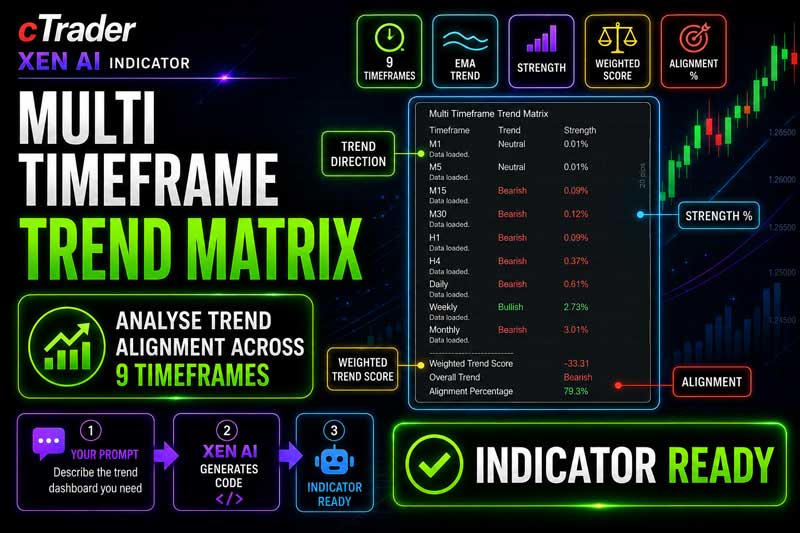
The cTrader Multi Timeframe Trend Matrix dashboard indicator analyses trend direction and strength across nine timeframes, from M1 through Monthly. It combines fast and slow exponential moving averages with configurable timeframe weighting to provide a clear overview of short-term, medium-term, and long-term market direction.
Each timeframe is classified as Bullish, Bearish, or Neutral using the percentage separation between the fast and slow EMAs. The dashboard then combines these results into a Weighted Trend Score, Overall Trend classification, and Alignment Percentage, helping traders understand whether market direction is broadly supported across multiple time horizons.
i
Multi-timeframe trend dashboard, EMA trend analysis, weighted trend scoring, trend-strength measurement, timeframe alignment, bullish and bearish market confirmation, and higher-timeframe trend filtering.
Multi-Timeframe Trend Analysis
A market can appear bullish on a short-term chart while remaining bearish on the higher timeframes. Reviewing only one timeframe can therefore provide an incomplete picture of current market direction.
The Multi Timeframe Trend Matrix solves this problem by analysing the same symbol across nine separate timeframes. Results are presented in a compact chart dashboard so traders can compare immediate price direction with broader market structure without opening multiple charts.
The matrix covers M1, M5, M15, M30, H1, H4, Daily, Weekly, and Monthly timeframes. This provides a broad view ranging from intraday market movement to long-term trend direction.
How the Indicator Works
For every displayed timeframe, the indicator calculates a configurable fast EMA and slow EMA. The default periods are 50 and 200.
The percentage separation between the two moving averages is used to determine both trend direction and raw trend strength. A configurable Neutral Threshold prevents very small EMA differences from being classified as meaningful trends.
The indicator uses the latest completed candle from each timeframe. This prevents the displayed historical result from changing while the current candle is still forming.
Each timeframe result contributes to the final Weighted Trend Score according to its configured weight and normalised trend strength. Higher timeframes receive greater default weights because their direction generally represents broader market structure.
Dashboard Timeframes
The dashboard displays one matrix row for each of the following timeframes:
- M1
- M5
- M15
- M30
- H1
- H4
- Daily
- Weekly
- Monthly
Every row shows the timeframe, current trend classification, and raw EMA separation strength.
Trend Classification
The trend direction for each timeframe is determined by comparing the fast EMA with the slow EMA.
Bullish is displayed when the fast EMA is above the slow EMA and the percentage separation is greater than the configured Neutral Threshold.
Bearish is displayed when the fast EMA is below the slow EMA and the percentage separation is greater than the configured Neutral Threshold.
Neutral is displayed when the EMA separation is equal to or below the Neutral Threshold, when insufficient historical data is available, or when the calculation cannot be completed reliably.
Bullish results are shown in green, bearish results in red, and neutral results in grey.
Trend Strength
Raw trend strength is calculated from the percentage separation between the fast and slow EMAs. A larger separation indicates that the moving averages are more widely separated, while a smaller value indicates weaker directional separation.
Strength is displayed as a percentage with two decimal places. It measures EMA separation rather than future price potential, trade probability, or expected profitability.
Weighted Trend Score
The Weighted Trend Score combines trend direction, timeframe importance, and normalised strength into one result ranging from -100 to +100.
Bullish timeframes contribute positive values, bearish timeframes contribute negative values, and neutral timeframes contribute zero. Each contribution is multiplied by the timeframe weight and its normalised trend strength.
The default weighting gives greater influence to higher timeframes:
| Timeframe |
Default Weight |
Market Perspective |
| M1 |
1 |
Very short-term price movement. |
| M5 |
1 |
Short-term intraday direction. |
| M15 |
2 |
Intraday trend confirmation. |
| M30 |
2 |
Broader intraday direction. |
| H1 |
3 |
Short-term market structure. |
| H4 |
4 |
Medium-term trend direction. |
| Daily |
5 |
Primary swing-trading trend. |
| Weekly |
6 |
Long-term market structure. |
| Monthly |
7 |
Major long-term market direction. |
Overall Trend Classification
The Weighted Trend Score is converted into a clear Overall Trend classification:
| Weighted Score |
Overall Trend |
| +60 to +100 |
Strong Bullish |
| +20 to below +60 |
Bullish |
| Above -20 to below +20 |
Neutral |
| Above -60 to -20 |
Bearish |
| -60 to -100 |
Strong Bearish |
Positive scores are shown in green, negative scores in red, and neutral results in grey.
Alignment Percentage
The Alignment Percentage measures how much of the active timeframe weight agrees with the dominant direction of the Weighted Trend Score.
Unlike a simple timeframe count, the calculation uses the configured timeframe weights. This means agreement from the Daily, Weekly, and Monthly trends contributes more than agreement from short intraday periods.
Neutral timeframes are excluded from both the aligned weight and the total non-neutral weight. When there is no dominant direction, or all timeframes are neutral, alignment is displayed as zero.
Alignment is shown in green when it is at least 75%, amber from 50% to below 75%, and grey below 50%.
Key Features
- Analyses nine timeframes from M1 through Monthly.
- Uses configurable fast and slow exponential moving averages.
- Uses completed candles to prevent intrabar trend changes.
- Classifies each timeframe as Bullish, Bearish, or Neutral.
- Displays raw EMA separation strength.
- Includes configurable neutral sensitivity.
- Calculates a Weighted Trend Score from -100 to +100.
- Provides an Overall Trend classification.
- Calculates weighted multi-timeframe alignment.
- Allows every timeframe weight to be customised.
- Handles unavailable data and insufficient history safely.
- Supports four dashboard chart positions.
- Includes adjustable font size and dashboard opacity.
- Works with the current chart symbol.
- Does not place, modify, or close trades.
How to Use it for Trading
The indicator is designed to provide market context rather than direct entry signals. Traders can use it to determine whether the timeframe they are trading agrees with the broader market direction.
For example, an intraday trader may look for buy opportunities when the M15 and H1 trends are bullish while the H4 and Daily timeframes also support the same direction. A high positive Weighted Trend Score with strong alignment indicates broader bullish agreement.
A low alignment reading may indicate that market direction is divided across the timeframes. This can occur during reversals, consolidation, pullbacks, or periods when short-term momentum conflicts with the longer-term trend.
The matrix can also act as a filter for automated or discretionary strategies. Traders may choose to avoid trend-following entries when the Overall Trend is Neutral or when alignment is weak.
The indicator does not predict future price direction and should not be used as a complete trading system.
Example Interpretations
Strong Bullish with high alignment: Most of the important timeframes are bullish, and the EMA separation is sufficiently strong to produce a high positive score.
Bullish with moderate alignment: The broader result is positive, but several timeframes may be bearish or neutral.
Neutral: Bullish and bearish contributions are balanced, EMA separation is weak, or many timeframes are neutral.
Bearish with low alignment: The weighted result is negative, but the bearish direction is not consistently supported across the active timeframes.
Strong Bearish with high alignment: Higher and lower timeframes are broadly aligned to the downside with sufficient EMA separation.
Complementary Indicators
The Multi Timeframe Trend Matrix works well with indicators that provide entry timing, volatility, momentum, and price-structure information.
- Support and Resistance indicators, to identify possible entry and exit areas.
- Market Structure indicators, to confirm swing highs, swing lows, and trend progression.
- ATR indicators, to measure volatility and plan protective stops.
- RSI or Stochastic indicators, to identify short-term momentum conditions.
- MACD indicators, to confirm momentum direction.
- Breakout indicators, to identify price movement beyond established ranges.
- Volume indicators, to evaluate participation behind a trend.
Inputs & Parameters
The indicator includes settings for trend calculation, strength normalisation, timeframe weighting, and dashboard appearance.
| Parameter |
Default/Type |
Description |
| Trend Calculation |
|
Controls EMA periods and neutral trend sensitivity. |
| Fast EMA Period |
50, int |
Period used for the faster exponential moving average. |
| Slow EMA Period |
200, int |
Period used for the slower exponential moving average. |
| Neutral Threshold Percentage |
0.02%, double |
Minimum EMA percentage separation required before a trend is classified as bullish or bearish. |
| Strength Normalisation Level |
0.50%, double |
EMA separation level treated as maximum normalised strength when calculating the weighted score. |
| Timeframe Weights |
|
Controls how strongly each timeframe contributes to the overall score. |
| M1 Weight |
1 |
Weight assigned to the one-minute trend. |
| M5 Weight |
1 |
Weight assigned to the five-minute trend. |
| M15 Weight |
2 |
Weight assigned to the fifteen-minute trend. |
| M30 Weight |
2 |
Weight assigned to the thirty-minute trend. |
| H1 Weight |
3 |
Weight assigned to the one-hour trend. |
| H4 Weight |
4 |
Weight assigned to the four-hour trend. |
| Daily Weight |
5 |
Weight assigned to the daily trend. |
| Weekly Weight |
6 |
Weight assigned to the weekly trend. |
| Monthly Weight |
7 |
Weight assigned to the monthly trend. |
| Dashboard Design |
|
Controls chart placement and dashboard presentation. |
| Dashboard Position |
Top Right, enum |
Positions the dashboard at the Top Left, Top Right, Bottom Left, or Bottom Right of the chart. |
| Font Size |
12, int |
Controls the text size used in the matrix and summary. |
| Dashboard Opacity |
Configurable |
Controls the transparency of the dashboard background. |
Calculation Logic
EMA Separation Percentage
Calculates the absolute difference between the fast and slow EMA, divides it by the slow EMA, and converts the result into a percentage.
Direction Value
Assigns +1 to Bullish, 0 to Neutral, and -1 to Bearish timeframe results.
Normalised Strength
Divides raw EMA separation by the Strength Normalisation Level and limits the result to a maximum value of 1.
Timeframe Contribution
Multiplies the timeframe direction value by its configured weight and normalised trend strength.
Weighted Trend Score
Adds all timeframe contributions, divides the result by the total configured timeframe weight, and converts it into a score between -100 and +100.
Alignment Percentage
Calculates the percentage of non-neutral timeframe weight that agrees with the dominant direction of the Weighted Trend Score.
Advantages
The indicator provides a structured view of trend direction across multiple timeframes and gives greater importance to higher-timeframe market structure. The Weighted Trend Score and Alignment Percentage make it easier to identify whether market direction is broadly supported or divided.
Disadvantages
EMA-based trend analysis is inherently delayed and may react slowly during reversals. Strong multi-timeframe alignment does not guarantee that price will continue in the same direction, and the dashboard should be combined with price action, volatility analysis, entry timing, and appropriate risk management.
Important Information
The indicator analyses only the symbol of the chart to which it is attached. It does not scan multiple symbols or place trades.
Results are calculated using the latest completed candle from each individual timeframe. This improves stability but means the dashboard will not react to changes occurring inside the currently forming candle until that candle closes.
Higher timeframe results may require sufficient historical data to calculate the slow EMA. When history is unavailable or insufficient, the affected timeframe is displayed as neutral rather than causing the indicator to stop.
How To Install & Remove
First, ensure the cTrader trading platform is installed. Unzip the downloaded file if required, then double-click the indicator file to install it automatically in cTrader.
Built with Xen AI
This cTrader Multi Timeframe Trend Matrix dashboard indicator was created using Xen AI, the AI coding assistant from ClickAlgo. Xen AI can build cTrader indicators, cBots, dashboards, plugins, and trading tools from plain English requirements.
Watch the video to see how the indicator was built step by step, from the initial dashboard layout through to EMA trend analysis, weighted scoring, and timeframe alignment.
New users can start with free credits and test Xen AI before upgrading. Learn more about Xen AI free credits.