cTrader Technical Analysis Widget
These beautiful free widgets will show you the current market technical trend for a major Forex currency pair graphically so that you will see the weight of all the technical indicators at a glance while trading using the cTrader trading platform. The widgets show the summary of 29-technical indicators and can be view in different timeframes to provide the trader with an excellent overview of the markets.
Technical Analysis Dashboard
The technical analysis dashboard is a web browser popup window showing all the major Forex pairs.
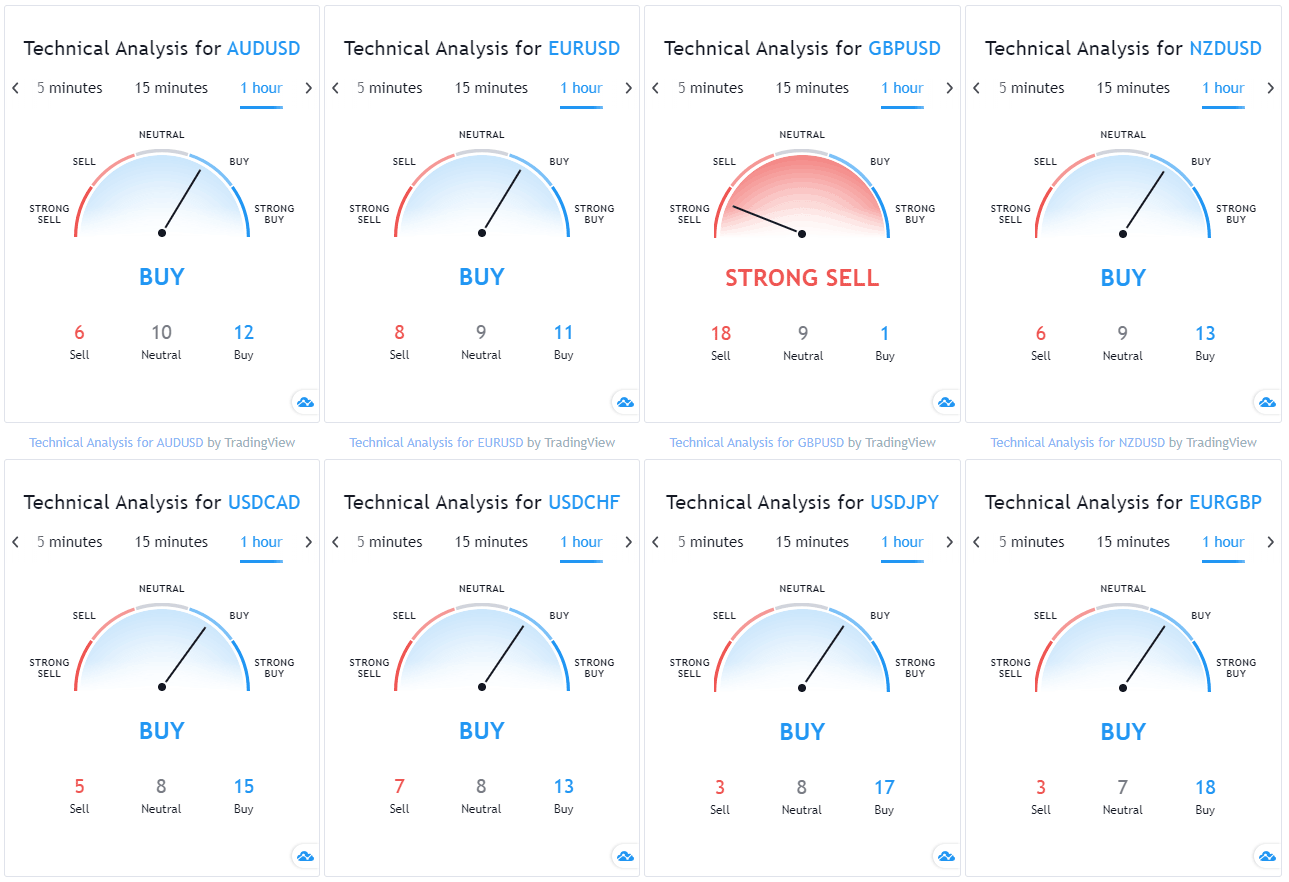
Launch The Technical Analysis Dashboard
You can also open a large window with all the major Forex pairs.
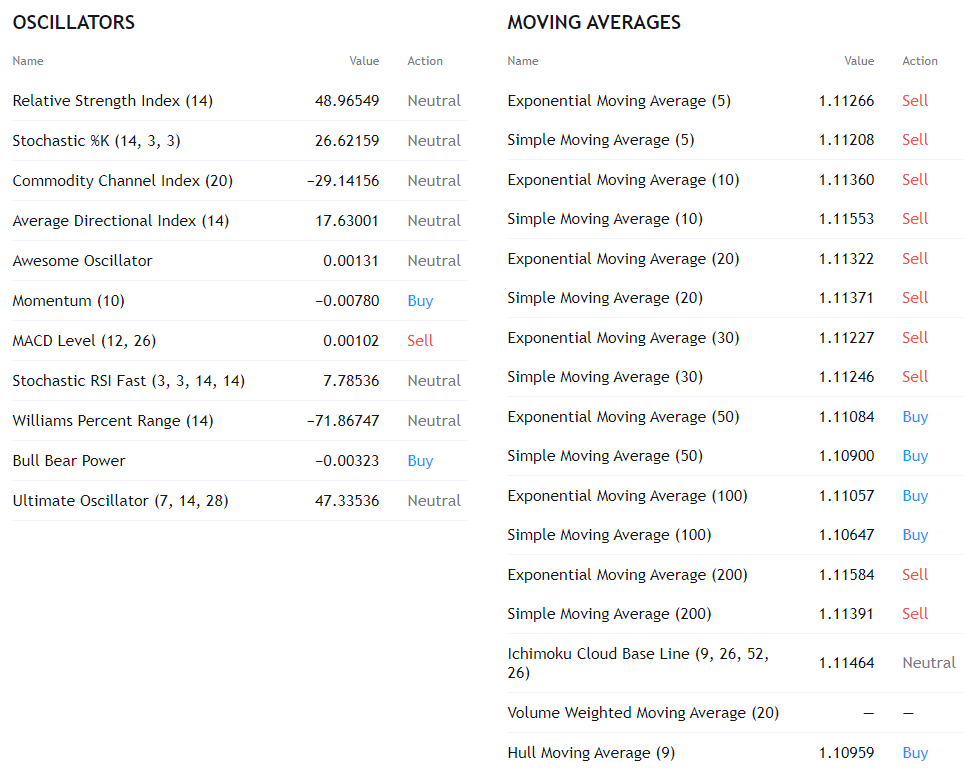
Real-Time Technical Data for EURUSD
The data below is displayed in real-time and taken from 29 technical indicators listed at the bottom of this page.
Launch Single Widgets
To open a widget in a popup window just select your currency pair below and start using it with any trading platform.
* if you would like to see more symbols added please email us at support@clickalgo.com
What is Technical Analysis?
The term technical analysis is used to define a trading discipline applied to assess investments and identify trading opportunities by examining statistical trends gathered from trading activity, these can include price movement and volume.
Watch a Video Overview
The video has been uploaded to 1080p High Quality, so do not forget to set your U-Tube video quality to 1080p HD.
Technical Indicators Used
The technical indicators that are used to calculate the market sentiment for the currency symbols are shown below.

Customer Rating 4.5 / 5
Based on verified reviews from our store.

