Indicator Overview
The cTrader Smart Money Trap Detector is designed to identify common retail trader traps, including failed breakouts, failed breakdowns, liquidity grabs, bull traps, and bear traps. These market conditions often occur when price briefly breaks above resistance or below support, attracts breakout traders, and then quickly reverses back through the level.
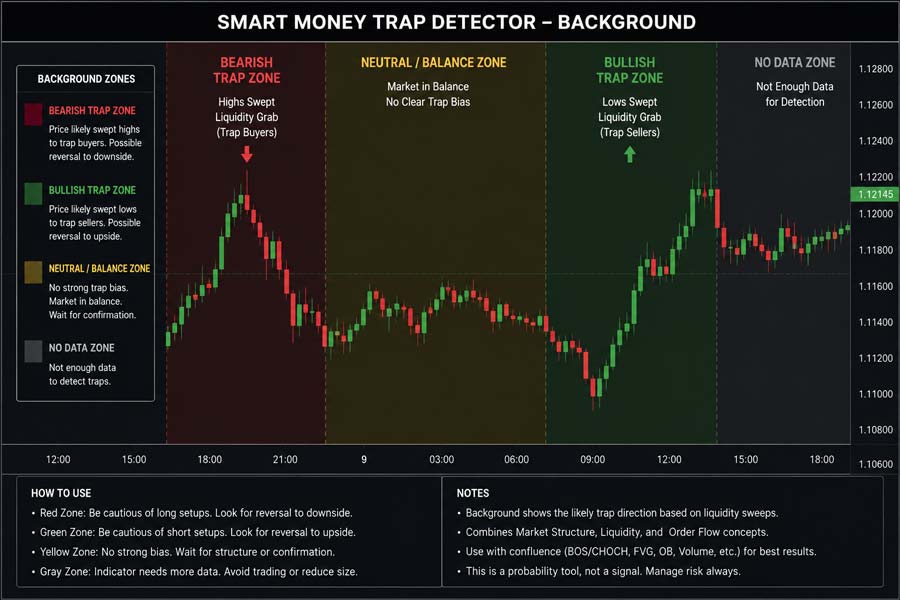
The indicator uses swing high and swing low levels to detect potential liquidity sweep areas. When price breaks beyond a recent swing level and then reverses within the selected confirmation window, the indicator marks the event directly on the chart with clear bull-trap or bear-trap signals.
i
Smart money trap indicator, failed breakout detection, failed breakdown detection, liquidity sweep zones, swing high and swing low analysis, bull trap markers, bear trap markers, and optional chart alerts.
Background & History
False breakouts are one of the most common problems faced by retail traders. A market may appear to break strongly above resistance or below support, only to reverse shortly afterwards. Traders who enter late on the breakout can quickly become trapped on the wrong side of the move.
Smart money and liquidity-based trading concepts often focus on these areas because stop losses and breakout orders tend to cluster around obvious swing highs and swing lows. When price sweeps these levels and then reverses, it can indicate that liquidity has been collected before the market moves in the opposite direction.
The Smart Money Trap Detector helps traders monitor these conditions visually by identifying failed breaks around recent swing levels and marking potential trap zones directly on the cTrader chart.
How the Indicator Works
The indicator scans recent price action to find swing highs and swing lows. A swing high acts as a potential resistance level, while a swing low acts as a potential support level. When price breaks above a recent swing high by more than the selected buffer and then reverses back below the level, the indicator marks a potential bull trap.
A bear trap is detected when price breaks below a recent swing low and then reverses back above the level within the selected confirmation window. The indicator can confirm reversals using either closing price behaviour or intrabar high and low behaviour, depending on the selected settings.
When enabled, sweep zones are drawn around the trapped liquidity level, helping traders see where the failed breakout or breakdown occurred. This makes it easier to review historical signals and understand how price reacted around major swing levels.
Key Features
The Smart Money Trap Detector provides a practical way to highlight failed breakout conditions and liquidity sweep behaviour without manually marking every swing level on the chart.
- Detects failed bullish breakouts above recent swing highs.
- Detects failed bearish breakdowns below recent swing lows.
- Marks bull traps and bear traps directly on the chart.
- Highlights optional liquidity sweep zones.
- Includes configurable swing strength and reversal confirmation settings.
- Supports optional alerts when new traps are detected.
- Works as an overlay indicator on all symbols and timeframes.
How to Use it for Trading
The indicator is best used as a confirmation and market structure tool. When a bull trap appears, it suggests that price has broken above a recent resistance area and then failed to hold above it. This can warn traders that breakout buyers may be trapped and that bearish pressure may be increasing.
When a bear trap appears, it suggests that price has broken below a recent support area and then failed to continue lower. This can indicate that sellers may be trapped and that bullish pressure may be returning.
The strongest signals often occur near obvious support and resistance zones, higher timeframe levels, session highs and lows, or areas where traders are likely to place stop losses. The indicator should not be used as a standalone buy or sell system, but it can help traders avoid poor breakout entries and identify areas where reversal confirmation may be worth watching.
Complementary Indicators
The Smart Money Trap Detector works well alongside tools that help confirm market structure, volatility, trend direction, and reversal conditions.
- Support and Resistance indicators, to confirm important reaction zones.
- Market Structure indicators, to validate swing highs, swing lows, and trend shifts.
- Volume Profile, to identify liquidity and participation zones.
- Average True Range, to measure volatility around trap areas.
- Moving Averages, to confirm broader trend direction.
- RSI or MACD, to confirm momentum divergence near trap signals.
Inputs & Parameters
Use these settings to control how swing levels are detected, how failed breaks are confirmed, and how signals are displayed on the chart.
| Parameter |
Default/Type |
Description |
| Detection |
|
Controls swing level and breakout detection. |
| Swing Strength |
3, int |
Controls how many bars are used on each side of a candle to confirm swing highs and swing lows. |
| Breakout Buffer (pips) |
1.0, double |
Minimum distance beyond a swing level required before a breakout or breakdown is considered valid. |
| Confirmation |
|
Controls how reversals are confirmed after a level is swept. |
| Reversal Window (bars) |
3, int |
Number of bars allowed for price to reverse after sweeping a swing level. |
| Use Close Confirmation |
true, bool |
When enabled, reversal confirmation uses the closing price rather than only intrabar highs or lows. |
| Visuals |
|
Controls chart markers, labels, and sweep zones. |
| Zone Width (pips) |
3.0, double |
Width of the highlighted liquidity sweep zone around the trapped level. |
| Show Sweep Zones |
true, bool |
Shows or hides highlighted sweep zones on the chart. |
| Show Trap Labels |
true, bool |
Shows or hides Bull Trap and Bear Trap text labels. |
| Max Signals On Chart |
25, int |
Limits the number of historical signal objects displayed to keep the chart clean. |
| Alerts |
|
Controls signal notification behaviour. |
| Enable Alerts |
false, bool |
Prints an alert message when a new bull trap or bear trap is detected. |
Logic Explanation
The indicator uses recent swing points as reference levels for potential liquidity traps. A bull trap forms when price breaks above a recent swing high, then reverses back below that resistance level. A bear trap forms when price breaks below a recent swing low, then reverses back above that support level.
Swing High Detection
Finds recent swing highs that may act as resistance and potential liquidity targets.
Swing Low Detection
Finds recent swing lows that may act as support and potential liquidity targets.
Bull Trap Detection
Detects when price breaks above resistance and then reverses back below that level within the confirmation window.
Bear Trap Detection
Detects when price breaks below support and then reverses back above that level within the confirmation window.
Liquidity Sweep Zones
Draws highlighted zones around the swept swing level to show where the failed breakout or breakdown occurred.
Advantages
The indicator helps traders identify failed breakout and failed breakdown conditions more objectively. It can reduce the risk of entering late into obvious breakout moves and provides useful context around swing highs, swing lows, and potential liquidity sweep zones.
Disadvantages
Not every failed breakout or liquidity sweep leads to a sustained reversal. Strong markets can retest swept levels and continue in the original direction. The indicator should be used with market structure, support and resistance, price action, and risk management rather than as a standalone trading system.
How To Install & Remove
First, ensure the cTrader trading platform is installed. Then unzip the file and double-click it to install automatically.
Built with Xen AI
This cTrader Smart Money Trap Detector was created using Xen AI, the AI coding assistant from ClickAlgo, to build cTrader indicators, cBots, plugins, dashboards, and trading tools from plain English prompts.
Watch the video to see how Xen AI helped build this indicator from concept to working cTrader code.
New users can start with free credits and test Xen AI before upgrading. Learn more about Xen AI free credits.


