Indicator Overview
The cTrader Trend Exhaustion Detector is designed to identify when an existing trend may be losing strength and approaching a potential reversal. Instead of relying on a single signal, the indicator combines momentum decay, volatility compression, and volume divergence into a unified Exhaustion Score. As these conditions align, the indicator increases the calculated Reversal Probability, helping traders recognise trends that may be losing momentum.
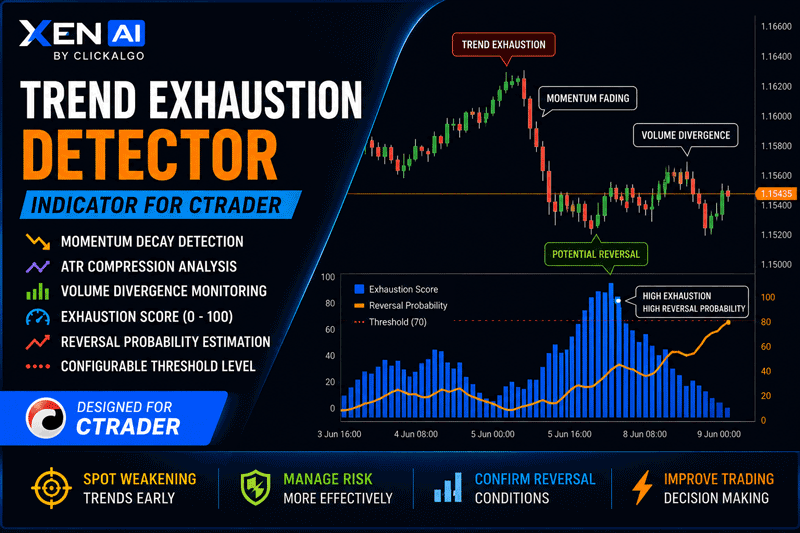
The indicator plots a histogram-based Exhaustion Score, a dynamic Reversal Probability line, and a configurable threshold level. When the exhaustion score exceeds the selected threshold, the probability of a reversal begins to increase, providing traders with an objective method for identifying potentially overextended market conditions.
i
Trend exhaustion indicator, momentum decay analysis, ATR compression detection, volume divergence monitoring, weighted scoring model, reversal probability estimation, configurable threshold levels, and adjustable weighting controls.
Background & History
One of the most difficult challenges in trading is recognising when a strong trend is approaching exhaustion. Trends often appear strongest immediately before they reverse, causing traders to enter late or hold positions beyond the point where momentum is fading.
Professional traders frequently monitor multiple market characteristics to identify weakening trends. Slowing momentum, contracting volatility, and abnormal volume behaviour often appear before significant reversals. The Trend Exhaustion Detector combines these concepts into a single quantitative model, allowing traders to monitor trend health without manually evaluating multiple indicators.
Rather than predicting exact turning points, the indicator highlights conditions where trend continuation may be becoming less likely and reversal risk is increasing.
How the Indicator Works
The indicator evaluates three separate market conditions. Momentum decay measures whether price movement is weakening compared to previous periods. ATR compression identifies periods where volatility contracts after an extended move. Volume divergence examines whether trading activity increases while price momentum begins to fade.
Each component generates a normalised score between 0 and 100. The scores are then combined using user configurable weights to create the final Exhaustion Score. When the score exceeds the selected threshold, the indicator calculates a Reversal Probability value that increases as exhaustion conditions strengthen.
- Measures momentum weakening across multiple periods.
- Detects volatility compression using ATR analysis.
- Identifies volume divergence conditions.
- Combines multiple signals into a weighted exhaustion score.
- Calculates reversal probability when exhaustion becomes significant.
- Displays threshold levels for visual confirmation.
Key Features
The Trend Exhaustion Detector provides a structured framework for analysing trend maturity and potential reversal conditions.
- Multi-factor trend exhaustion analysis.
- Momentum decay measurement.
- ATR compression detection.
- Volume divergence analysis.
- Weighted scoring model with custom inputs.
- Exhaustion Score histogram display.
- Reversal Probability line output.
- Configurable exhaustion threshold.
- Suitable for all markets and timeframes.
- Works as a confirmation tool alongside existing strategies.
How to Use it for Trading
The indicator is best used as a market condition and trade management tool rather than a direct entry system. Rising exhaustion scores indicate that current trend conditions may be weakening. When the score exceeds the threshold and reversal probability begins to increase, traders may consider tightening stops, reducing exposure, or looking for confirmation of a reversal.
Strong exhaustion readings can be particularly valuable when they occur near major support and resistance levels, historical swing points, or higher timeframe technical zones.
- Monitor exhaustion levels during strong trends.
- Look for rising reversal probability after extended moves.
- Use as a warning signal rather than an entry trigger.
- Combine with support and resistance analysis.
- Confirm signals with price action and market structure.
- Use for trade management and profit protection.
- Always apply appropriate risk management.
Complimentary Indicators
The Trend Exhaustion Detector works particularly well alongside indicators that provide trend, momentum, and market structure confirmation.
- Relative Strength Index, momentum confirmation and divergence analysis.
- Average True Range, volatility confirmation and stop placement.
- Moving Averages, trend direction confirmation.
- MACD, momentum trend confirmation.
- Smart Money Structure, market structure validation.
- Volume Profile, liquidity and participation analysis.
- Support and Resistance indicators, reversal zone confirmation.
Inputs & Parameters
Use these settings to adjust the sensitivity of momentum, volatility, volume analysis, and the final exhaustion scoring model.
| Parameter |
Default/Type |
Description |
| Momentum |
|
Momentum decay settings. |
| Momentum Period |
14, int |
Number of bars used to calculate price momentum. |
| Momentum Decay Lookback |
5, int |
Compares current momentum against previous momentum values. |
| Volatility |
|
ATR compression settings. |
| ATR Period |
14, int |
Period used for ATR calculations. |
| ATR Compression Lookback |
20, int |
Number of bars used to evaluate volatility compression. |
| Volume |
|
Volume divergence settings. |
| Volume Period |
20, int |
Moving average period for volume analysis. |
| Volume Divergence Lookback |
5, int |
Lookback period used to identify volume divergence. |
| Weights |
|
Controls contribution of each component. |
| Momentum Weight |
0.40, double |
Weight assigned to momentum decay. |
| ATR Weight |
0.35, double |
Weight assigned to volatility compression. |
| Volume Weight |
0.25, double |
Weight assigned to volume divergence. |
| Signals |
|
Signal generation settings. |
| Exhaustion Threshold |
70, double |
Minimum score required before reversal probability is calculated. |
Formula Explanation
The indicator combines three independent measurements into a single weighted score.
Momentum Decay
Measures whether current momentum is weaker than previous momentum. Larger reductions indicate greater trend exhaustion.
ATR Compression
Measures where current ATR sits within its recent volatility range. Lower volatility often appears before major directional changes.
Volume Divergence
Identifies situations where trading activity increases while price momentum slows, indicating possible distribution or accumulation.
Exhaustion Score
Exhaustion Score = (Momentum Score × Momentum Weight) + (ATR Score × ATR Weight) + (Volume Score × Volume Weight)
Reversal Probability
Calculated only when the Exhaustion Score exceeds the selected threshold. Higher scores generate higher reversal probabilities.
Advantages
The indicator combines multiple market factors into a single objective measurement. It can help traders identify weakening trends, manage existing positions more effectively, and avoid entering trends that may already be approaching exhaustion. The weighted model allows traders to customise the behaviour for different markets and trading styles.
Disadvantages
No exhaustion model can predict exact reversal points. Strong trends can remain overextended for long periods, causing exhaustion readings to remain elevated before a reversal occurs. The indicator should be used as a confirmation and risk management tool rather than a standalone buy or sell signal generator.
How To Install & Remove
First, ensure the cTrader trading platform is installed. Then unzip the file and double-click it to install automatically.
Built with Xen AI
This cTrader Trend Exhaustion Detector was created using Xen AI, the AI coding assistant from ClickAlgo, to build cTrader indicators, cBots, plugins, dashboards, and trading tools from plain English prompts.
Watch the video to see how Xen AI helped build this indicator from concept to working cTrader code.
New users can start with free credits and test Xen AI before upgrading. Learn more about Xen AI free credits.


