History and Background
VWAP, Volume Weighted Average Price, began as an execution benchmark on dealing desks. Traders compare prices to VWAP to judge fair value, premium, and discount. Anchored VWAP extends the idea; instead of resetting only at session open, you can anchor to moments that matter, earnings gaps, swing highs, policy announcements, market opens in other regions, or your custom regime windows. This makes it a practical lens for mean reversion, pullback entries, and profit taking around value.
How to Use the Anchored VWAP
To get started using the A-VWAP indicator, you first need to attach the indicator to a chart. You can scroll down the page for instructions on how to install and attach the indicator to a chart. The A-VWAP indicator will allow you to drag the vertical anchor line to any date or time in the past to set the starting point for the VWAP to be calculated, taking into account the price and volume for that trading period.
-
You define a window in time, either by dragging a Start and End vertical line on the chart, or by enabling Use Custom Dates and entering precise timestamps.
-
For each bar inside that window, the indicator accumulates price times volume and divides by cumulative volume to plot the anchored VWAP for that window only.
-
Outside the window, the line stays hidden, keeping the chart focused and uncluttered.
-
You can choose the VWAP price basis, Typical, High, Low, Median, and customise line colour, style, and thickness.
-
Lines are fully interactive; you can rename their identifiers if your layout already uses specific object names.
Choosing the Right Anchor Point
The chosen anchor point must align with your trading strategy, serving as a significant and pertinent price reference, so when deciding on an anchor point, take into account the following key factors:
-
Pivot Point: Pivot points are used in technical analysis to serve as a viable anchor point for the A-VWAP indicator, these points are derived from the highs, lows, and closing prices of the preceding day, aiding in the recognition of potential support and resistance levels.
-
High or low points: This popular method uses a peak or trough as the anchor point and this could include a swing high or low, a pivotal support or resistance threshold, or any level indicative of a pivotal shift in price dynamics.
-
Time-based reference point: This alternative strategy involves employing a distinct date or time as the anchor point, an example would be when you might choose to use the commencement of the trading week, month, quarter, or year as the anchor point for computing the A-VWAP from that juncture onward.
- Event-based reference point: A reference point based on events could include an economic report, earnings declaration, or any notable incident with market implications.
How to use it for Trading
-
Mean reversion fades when price stretches far above the anchored VWAP during your event window. Look for exhaustion and reversal cues back toward value, a mirror for downside.
-
Pullback entries in trends, in a trend leg, anchor from the impulse start, buy pullbacks into the anchored VWAP in an up move, sell pullbacks in a down move.
-
Event studies, anchor across the hours after an earnings release or macro print, use VWAP reclaim or rejection as a quick bias filter.
-
Risk framing, use anchored VWAP as a dynamic stop or trail reference; price acceptance above or below it helps confirm trade continuation.
-
Multi-window confluence, run several instances anchored to different swing starts, confluence zones often mark decision areas.
How to Use Multiple AVWAP Indicators?
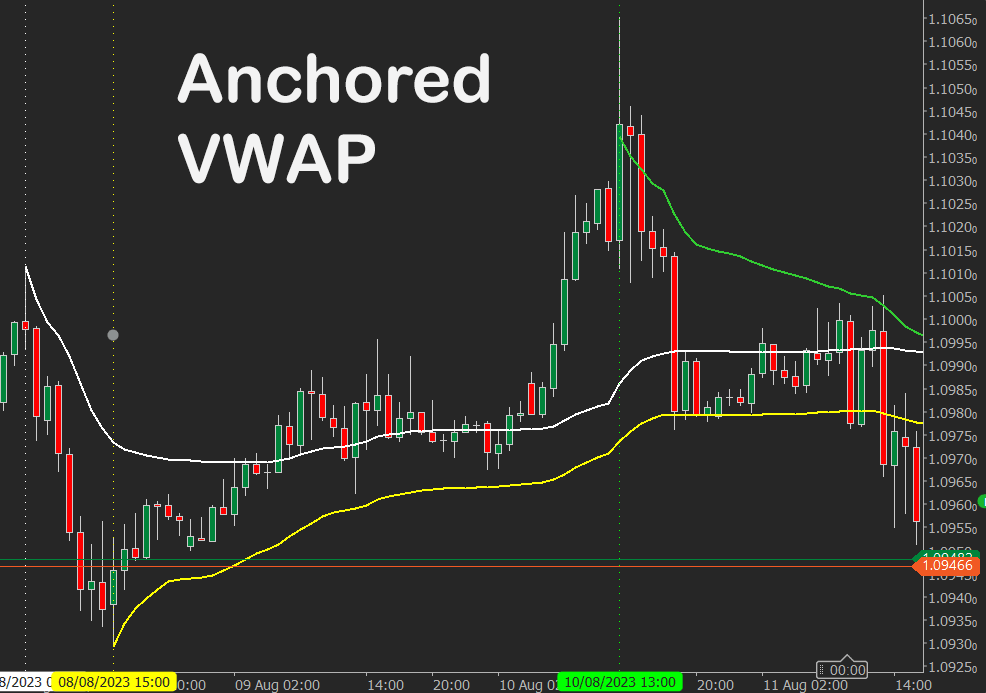
If you wish to attach multiple Anchor VWAP indicators to the same chart with different anchor points and settings, you need to make sure that the Line Identifier setting is a unique value like line-1, line-2 etc. The image above shows three different VWAP indicators that have been attached to a EURUSD chart.
Using the Anchored VWAP on Multiple Charts
You can load several instances of the Anchored VWAP on the same chart or across multiple charts without conflict. Each instance generates its own internal line identifiers so that start and end anchors remain independent. This means you can compare different windows of VWAP at the same time, for example, anchoring one study to the weekly open while another tracks the most recent news release.
When working with multiple instances, keep in mind:
- Custom Dates: If you prefer a fixed, repeatable study, enable Use Custom Dates with specific start and end timestamps. These will remain stable even if you change the timeframe or reload the chart.
- Live Update: If you enable Live Update, the indicator will hide its End line and extend to the latest bar. Only the Start line remains visible. Each instance can have its own Start point, so you can run several live VWAPs simultaneously anchored to different events.
- Chart Timeframes: Changing the chart’s timeframe will not affect any instance that is set with Custom Dates. For live instances that use draggable Start lines, the anchor may shift if you have not defined a fixed timestamp in the Start parameter. To lock the Start point across timeframes, enter a specific Start date and time.
- Visibility: Use the Hide Lines option to keep your chart uncluttered after positioning the anchors. In Live Update mode, the End line is hidden automatically.
This flexibility allows you to run side-by-side comparisons, for example, one VWAP anchored to the monthly open on a daily chart, and another anchored to today’s session open on a 5-minute chart, each updating independently.
Indicator Settings Explained
The Anchored VWAP indicator includes a flexible set of parameters that allow you to control how the anchor points are defined, whether the calculation window is fixed or continuously updated, and how the VWAP line is displayed on the chart. The following table outlines each input and its function.
| Parameter |
Default, Type |
Description |
| Inputs |
| VWAP Price |
Typical, enum |
Select the price basis, Typical, High, Low, Median. |
| Range Selection |
| Use Custom Dates |
false, bool |
When true, uses the Start and End timestamps and hides draggable lines. |
| Start (yyyy-MM-dd HH:mm) |
2025-01-01 00:00, string |
Start of the calculation window when using custom dates. |
| End (yyyy-MM-dd HH:mm) |
2025-12-31 23:59, string |
End of the calculation window when using custom dates. |
| Live Mode |
| Live Update |
false, bool |
When true and using draggable lines, only the Start line is used, the End line is hidden, and the VWAP extends to the latest bar in real time. Ignored when Use Custom Dates is true. |
| Visual |
| Line Color |
Yellow, Color |
Color for the VWAP plot and anchor lines. |
| Line Thickness |
1, int |
Thickness for the VWAP plot and anchor lines. |
| Line Style |
Lines, LineStyle |
Style applied to the anchor lines. |
| Hide Lines |
false, bool |
Hides the draggable lines on the chart. In Live Update the End line is hidden automatically. |
| Advanced |
| Line Identifier Start |
StartLine, string |
Name for the Start line object. |
| Line Identifier End |
EndLine, string |
Name for the End line object. Hidden automatically in Live Update. |
Line Identifier Start / End – These settings allow advanced users to change the base names of the Start and End anchor lines. Each instance of the indicator automatically generates unique identifiers internally, so you do not need to adjust these parameters for normal use. They are mainly useful if you run automated scripts or other indicators that need to reference specific chart object names, or if you prefer custom naming for easier identification in the chart’s object list.
How To Install & Remove
First, make sure you have the cTrader trading platform installed. Then, unzip the file and double-click on it to automatically install it onto the platform.
Need Extra Help?
Get instant answers with cTrader Sensei — our free AI assistant built for the cTrader platform. It can explain the indicator settings, suggest trading strategies, and guide you step-by-step through this indicator. Rated 4.9 out of 5 in the ChatGPT Store.
Chat with cTrader Sensei
Prefer human help? Visit our support forum where our team and community can assist you.
Note: cTrader Sensei runs on OpenAI's ChatGPT platform. To use it, you will be asked to create a free OpenAI account. Registration is quick and costs nothing.
The free version works immediately, but upgrading to a ChatGPT Plus subscription unlocks the latest GPT model, which provides more accurate and detailed answers for trading, coding, and product support.
To upgrade, log in to ChatGPT, click your profile in the bottom left, and select Upgrade to Plus.
Need a Broker
If you're still looking for a broker with tight spreads and fast execution, visit our top cTrader broker site.


