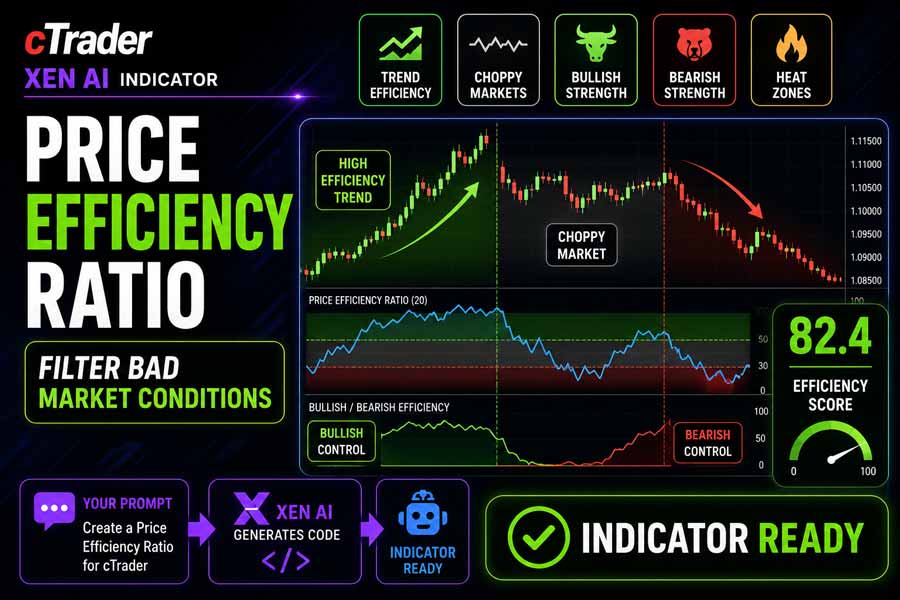
The cTrader Price Efficiency Ratio indicator measures how efficiently price is moving over a selected lookback period. It compares the net distance travelled by price against the total movement taken to get there, helping traders distinguish between clean directional movement and noisy, choppy market behaviour.
High efficiency readings suggest that price is moving with stronger directional quality and less unnecessary noise. Low efficiency readings suggest that price is moving inefficiently, often during ranging, sideways, or choppy market conditions. The indicator is designed to serve as a market-condition filter for trend-following, breakout, and momentum trading strategies.
i
Price efficiency indicator, trend quality measurement, choppy market detection, bullish efficiency analysis, bearish efficiency analysis, efficiency heat zones, and market condition filtering.
Background & History
Many traders focus on whether price is rising or falling, but the quality of that movement is just as important. A market can move from one price level to another along a clean, directional path, or it can reach the same destination after repeated back-and-forth movements. The second example is less efficient and often harder to trade.
Price efficiency analysis helps traders understand whether the market is moving with purpose or simply producing noise. This concept is closely related to market quality, trend strength, and trading conditions, but it is less commonly used than traditional momentum or trend indicators.
The Price Efficiency Ratio turns this concept into a clear oscillator, making it easier to identify when conditions are suitable for trend-based trading and when the market may be too choppy for reliable entries.
How the Indicator Works
The indicator calculates the net price movement over the selected lookback period and compares it with the total price movement during the same period. If price moves cleanly from one point to another, the efficiency ratio rises. If price moves back and forth with limited directional progress, the ratio falls.
The main Efficiency Ratio is displayed as an oscillator from 0 to 100. A smoothed signal line is included to help confirm changes in market quality. The indicator also separates bullish and bearish efficiency depending on whether price has moved higher or lower over the lookback period.
Efficiency Heat Zones highlight high quality directional conditions, while Choppy Market Zones highlight low efficiency conditions where price movement may be noisy and less suitable for trend following or breakout strategies.
Key Features
The Price Efficiency Ratio provides a simple way to judge market quality before entering or managing trades.
- Calculates Price Efficiency Ratio from 0 to 100.
- Compares net price movement with total price movement.
- Includes a smoothed signal line for confirmation.
- Displays Trend Efficiency Score.
- Separates bullish efficiency and bearish efficiency.
- Highlights high efficiency and choppy market zones.
- Includes optional alerts for efficiency zone changes.
- Works across all symbols and timeframes supported by cTrader.
How to Use it for Trading
This indicator is best used as a market condition filter. When efficiency is high, price is moving more cleanly and directional strategies may have better conditions. When efficiency is low, the market may be choppy, ranging, or directionless, making trend entries more vulnerable to false moves.
Trend traders can use high efficiency readings to confirm that price is moving with strong directional quality. Breakout traders can use the indicator to avoid breakouts that occur during noisy market conditions. Momentum traders can use it to check whether price movement is supported by efficient directional progress.
The indicator does not predict future direction. It measures the quality of recent price movement, helping traders decide whether current conditions are worth trading or better avoided.
Complementary Indicators
The Price Efficiency Ratio works well with tools that provide trend direction, momentum, and market structure context.
- Moving Averages, to confirm broader trend direction.
- Market Structure indicators, to validate trend progression.
- ATR indicators, to assess volatility conditions.
- RSI or MACD, to confirm momentum strength.
- Support and Resistance indicators, to identify important reaction zones.
- Breakout indicators, to filter weak or noisy breakout conditions.
Inputs & Parameters
Use these settings to adjust the lookback period, smoothing behaviour, efficiency thresholds, and optional alert notifications.
| Parameter |
Default/Type |
Description |
| Parameters |
|
Main calculation and smoothing settings. |
| Lookback Period |
20, int |
Number of bars used to compare net price movement with total price movement. |
| Smoothing Period |
5, int |
Period used to smooth the efficiency ratio signal line. |
| Thresholds |
|
Controls high efficiency and low efficiency zone levels. |
| High Efficiency Threshold |
70.0, double |
Minimum efficiency value required to highlight a high efficiency heat zone. |
| Low Efficiency Threshold |
30.0, double |
Maximum efficiency value used to highlight a choppy market zone. |
| Alerts |
|
Controls optional zone change alerts. |
| Enable Alerts |
false, bool |
Shows an alert when price efficiency enters high efficiency or low efficiency conditions. |
Logic Explanation
The indicator measures the relationship between direct price movement and the total distance price travelled over the lookback period. Cleaner directional movement produces higher efficiency readings, while noisy movement produces lower readings.
Net Price Movement
Measures the absolute distance between the current close price and the close price from the selected lookback period.
Total Price Movement
Adds the absolute close to close movement for each bar inside the lookback period.
Price Efficiency Ratio
Compares net movement with total movement and converts the result into a 0 to 100 oscillator.
Bullish and Bearish Efficiency
Assigns the efficiency reading to bullish or bearish efficiency depending on whether price moved higher or lower over the lookback period.
Efficiency Zones
Highlights high efficiency zones when price movement is clean and low efficiency zones when market movement is choppy.
Advantages
The indicator helps traders filter poor market conditions by identifying whether price is moving efficiently or behaving in a noisy, choppy manner. It can be especially useful for trend following, breakout, and momentum strategies where market quality matters.
Disadvantages
High efficiency does not guarantee that a trend will continue, and low efficiency does not always mean the market should be avoided. The indicator measures recent movement quality and should be used with price action, market structure, volatility, and risk management.
How To Install & Remove
First, ensure the cTrader trading platform is installed. Then unzip the file and double-click it to install automatically.
Built with Xen AI
This cTrader Price Efficiency Ratio indicator was created using Xen AI, the AI coding assistant from ClickAlgo, to build cTrader indicators, cBots, plugins, dashboards, and trading tools from plain English prompts.
Watch the video to see how Xen AI helped build this indicator from concept to working cTrader code.
New users can start with free credits and test Xen AI before upgrading. Learn more about Xen AI free credits.


