History and Background
The Kalman filter was developed in the early 1960s by Rudolf E. Kálmán, originally for aerospace navigation and guidance systems. Its ability to estimate the actual state of a moving object from noisy measurements quickly made it worthwhile in engineering, robotics, and economics. Over time, traders began adapting the algorithm to financial markets, where price data is inherently noisy. When applied to trading charts, the indicator can smooth out erratic price moves and remain highly responsive, providing a more reliable read on market direction than many other traditional moving averages.
How the Indicator Works
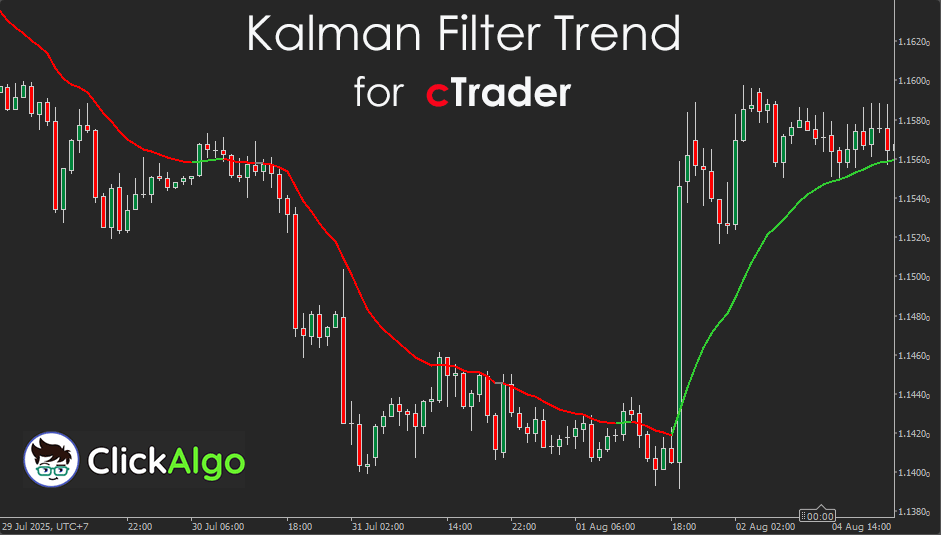
It applies a scalar Kalman filter to your chosen price stream, usually Close. Each bar predicts the next value, compares it to the new price, and then blends the two using a dynamic weight called the Kalman gain. In choppy conditions, the model trusts itself more; in cleaner conditions, it leans into the latest price. The line updates in real time and can be shown as a single curve or as colored segments for bullish, bearish, and neutral states.
Additional features in this build
-
Trend colouring toggle
UseTrendColoring lets you switch between a single continuous line and output KalmanLine, and three colour-separated lines, outputs Bullish, Bearish, Neutral. When colouring is on, the main line is hidden, so the chart stays clean.
-
Neutral state control
Flat Threshold, Epsilon defines what counts as flat. If the change between consecutive filtered values is within this small band, the segment is drawn as Neutral. Great for ranging sessions and session opens.
-
Discontinuous segments that join smoothly
The code writes the previous and current points for the active state, which avoids gaps on colour flips and gives a continuous look to each state line.
-
Parameter-based responsiveness
Q, Process Noise governs adaptability. Higher values, quicker turns and less smoothing.
R, Measurement Noise Governs trust in price. Higher values, more smoothing and fewer false flips in choppy feeds.
-
Overlay drawing with clear styling
Overlay set to true, bold default colours, DodgerBlue for the single line, LimeGreen, Red, Gray For states, thickness 2 for easy visibility on dark and light themes.
-
Lightweight and safe
No access rights, UTC zone, runs on any symbol and timeframe with low CPU use. Designed to handle multiple chart instances.
How to Use it for Trading
-
Trend confirmation
Trade in the direction of the filter slope. Rising line, only look for longs. Falling line, only look for shorts.
-
Color shifts
Use bullish, bearish, and neutral segments as simple signals for entries and exits.
-
Pullback entries
In a trend, let price pull back toward the filter, then enter when price snaps back with the filter still sloping the same way.
-
Noise tuning
If you get chopped, increase R to trust price less, or increase Q to let the model adapt faster during strong moves.
-
Combine with risk tools.
Pair with swing highs, swing lows, ATR stops, or session filters to avoid flat periods.
Typical parameters
-
Price Source, the data series to filter, usually Close.
-
Process Noise, Q, adaptability of the model, try 0.0001 to 0.001 on calm symbols, 0.001 to 0.01 on fast movers.
-
Measurement Noise, R, trust in price versus the model, higher values reduce flicker in chop.
-
Flat Threshold, Epsilon, slope band for neutral colouring, default 1e-5.
-
Use Trend Colouring, true draws three colored state lines, false draws one continuous line.
Kalman Filter Trend Formula
Prediction step:
x̂ₜ|ₜ₋₁ = x̂ₜ₋₁
Pₜ|ₜ₋₁ = Pₜ₋₁ + Q
Update step:
Kₜ = Pₜ|ₜ₋₁ / (Pₜ|ₜ₋₁ + R)
x̂ₜ = x̂ₜ|ₜ₋₁ + Kₜ · (zₜ − x̂ₜ|ₜ₋₁)
Pₜ = (1 − Kₜ) · Pₜ|ₜ₋₁
Where:
- zₜ is the observed price, usually the Close.
- x̂ is the filtered value drawn on the chart.
- P is the error variance estimate.
- Q is process noise, model adaptability.
- R is measurement noise, trust in price.
No single setting fits every symbol or session. In extremely choppy markets the line can still flip color frequently. Q and R need a quick tune per instrument, once set they tend to be stable.
How To Install & Remove
First, ensure that you have the cTrader trading platform installed. Then, unzip the file and double-click it to install the platform automatically.
Need Extra Help?
Get instant answers with cTrader Sensei — our free AI assistant built for the cTrader platform. It can explain the indicator settings, suggest trading strategies, and guide you step-by-step through this indicator. Rated 4.9 out of 5 in the ChatGPT Store.
Chat with cTrader Sensei
Prefer human help? Visit our support forum where our team and community can assist you.
Note: cTrader Sensei runs on OpenAI's ChatGPT platform. To use it, you will be asked to create a free OpenAI account. Registration is quick and costs nothing.
The free version works immediately, but upgrading to a ChatGPT Plus subscription unlocks the latest GPT model, which provides more accurate and detailed answers for trading, coding, and product support.
To upgrade, log in to ChatGPT, click your profile in the bottom left, and select Upgrade to Plus.
Need a Broker
If you're still looking for a broker with tight spreads and fast execution, visit our top cTrader broker site.


