cTrader Bullish Engulfing Candlestick Pattern
"The Bullish Engulfing Candlestick Pattern is a bullish reversal pattern, usually occurring at the bottom of a downtrend"
What is a Bullish Engulfing Pattern?
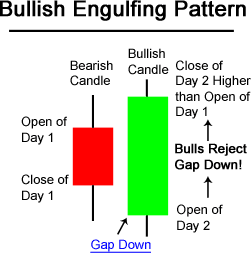
A cTrader bullish engulfing pattern is a candlestick chart pattern that forms when a small red bearish candlestick is followed by a large green bullish candlestick and the body of which completely overlaps or engulfs the body of the previous bearish candlestick. The trader does not act only on this signal, but together with other market signals.

"Ultimately, traders want to know whether a bullish engulfing pattern represents a change of sentiment, which means it may be a good time to buy"
Bullish Engulfing Buy Signal Scenarios
There are three main scenarios when a trader might buy using the Bullish Engulfing Pattern.
Scenario #1
A trader might open a long position at the close of the 2nd day when prices have rallied upwards from the gap down in the morning. It is common to interpret that the rally on the 2nd day was a significant signal signalling a reversal in the market. A confirmation signal would be a substantial increase in volume that accompanied the large move upward in price.
Scenario #2
A trader might open a long position on the day after the Bullish Engulfing Pattern forms, it is best to wait until the next day to buy, a confirmation is required that the bullish reversal of the prior day is continuing and was not just a one-day occurrence like a short-covering rally. The diagram above shows that a trader might not enter the market long on the day after the Bullish Engulfing Pattern because the market gapped down significantly and even made new lows. A trader using scenario #2 would likely wait for a different potential buy signal.
Scenario #3
A trader might wait after the bullish engulfing pattern for another signal, mainly a price break above the downward resistance line before entering a buy order.

Why It Matters
The bullish engulfing pattern shows a potential reversal of investor sentiment and is suggestive of an instrument has reached its minimum value over a given time period.
Bullish Engulfing Pattern Detection Software?
Take a quick look at the cTrader Bullish Engulfing Candlestick Detector Indicator, this indicator will automatically identify trade setups and send alerts.


