cTrader Hammer Candlestick Pattern
A cTrader hammer candlestick is a type of bullish reversal candlestick pattern and it is made up of just a single candle, the candle will normally look like a hammer, as it has a long lower wick and a short body at the top of the candlestick with little or no upper wick. Just because a signal is composed of only one candlestick, that doesn’t mean it can’t pack a big punch.
What Is a Hammer Pattern?
The Hammer candlestick is mostly viewed as a bullish reversal candlestick pattern that occurs at the bottom of downtrends. The Hammer pattern is created when the open, high, and close prices are about the same price and there will be a long lower shadow, twice the length as the real body.
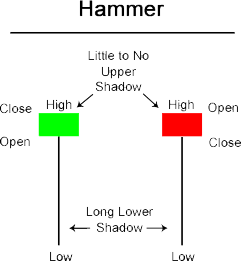
Hammer candlesticks form when shares fall from their opening prices due to selling pressure, but then they manage to recover most or all of the losses within the trading period.
Reading a Hammer Formation Correctly
Just because the Hammer pattern is just a single candle, you will also need to observe the other candles surrounding it to confirm that the candle you are looking at is indeed a hammer candlestick pattern, it will need to meet the requirements shown below for a downward trend.
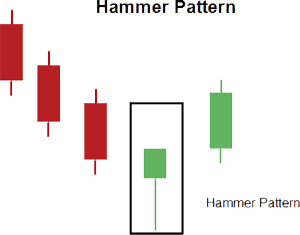
If the Hammer candlestick pattern forms in a downtrend as shown in the image above. It’s considered a market bottom or support, we offer both a Hammer candlestick detector indicator and support & resistance indicator so you can take advantage of this trade setup.
- The candle must have either a very short upper shadow or no upper shadow at all.
- The candle’s lower shadow must be at least two times as long as the real body.
- The signal must occur after a clear downtrend.
- The candle’s body should be located at the upper end of the trading range. Its colour is unimportant, though a green candle hints at a more bullish effect.
- The signal should be confirmed the following day, with the price trading above the Hammer’s real body.
- Never confuse the Hammer candle with a Hanging Man, which looks identical but only forms at the end of uptrends, while the Hammer occurs after downtrends.
What Is The Hammer Pattern Telling You?
Following on from the image above with a downtrend and a Hammer pattern candle, the bears are winning and have pushed the trend even lower, but now the bulls take control and start to push the price back up, in this case, the bears are losing the battle, this causes a long shadow beneath a small body (hammer pattern).
Verification Signals
A few other signals you need to look out for when the candle forms.
- If the candle has a long lower shadow there will be a higher chance of a price reversal.
- If there was a lot of trade volume on the day the hammer forms, it will probably mean a blow-off has occurred (last breath of trading).
- If you see that the candle has a gap down from the previous day's close price, this will probably mean a strong reversal will happen as long as the day after the hammer has formed, the price opens higher.
- An easy verification is that and if a candle is green it will show a bullish sign and if red, this will show a bearish sign.
Inverted Hammer Pattern
The Hammer pattern has a brother in the form of an inverted Hammer, this is a candlestick pattern that is usually found after a downtrend and signals a trend reversal. The inverted hammer looks like a reverse version of the hammer candlestick pattern, and when it appears in an uptrend is called a shooting star.
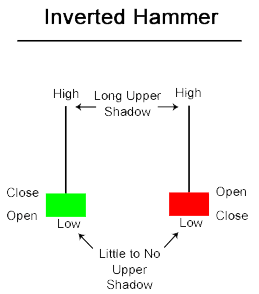
If there is a long downtrend and a bullish Inverted Hammer is formed, this will mean that the prices hesitated their move downward by increasing significantly during the day. The sellers then came back and pushed prices back near the open. The fact that the prices were able to increase shows that bulls are testing the power of the bears. Observe what happens on the next day as this is what gives traders an idea as to whether or not prices will go higher or lower.
Hammer Pattern Detection Software?
Take a quick look at the cTrader Hammer Candlestick Detector Indicator, this indicator will automatically identify Hammer trade setups.

Customer Rating 4.5 / 5
Based on verified reviews from our store.

