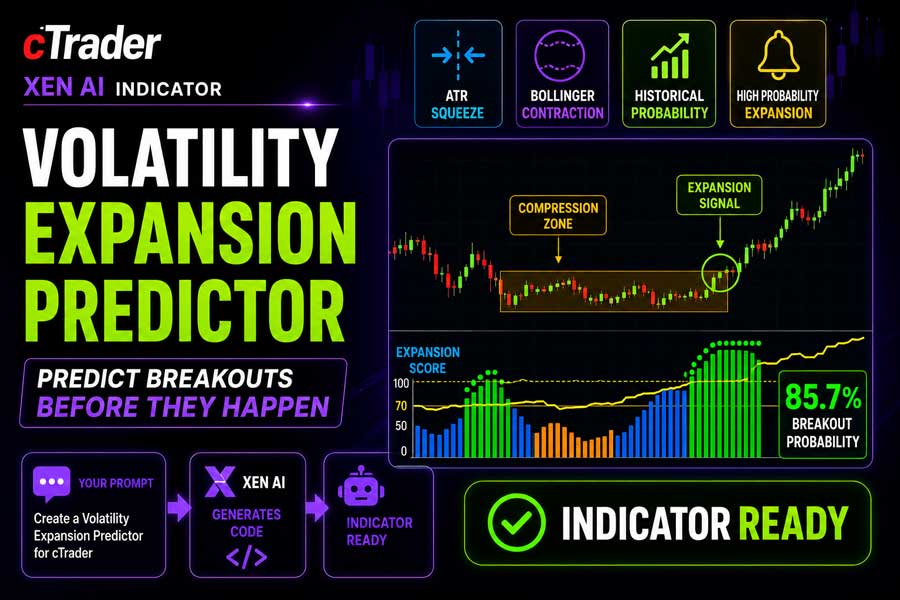
The cTrader Volatility Expansion Predictor is designed to identify volatility-compression conditions that can precede larger breakout moves. Instead of predicting direction, the indicator focuses on detecting when the market has become unusually compressed and when the probability of a volatility expansion may be increasing.
The indicator combines ATR squeeze analysis, Bollinger Band contraction, and historical breakout probability into a single visual tool. It displays a Volatility Expansion Score, Breakout Probability line, Compression Zone histogram, and Expansion Signal markers in a separate indicator panel.
i
Volatility expansion indicator, ATR squeeze analysis, Bollinger Band contraction detection, compression zone monitoring, historical breakout probability, expansion signal detection, and breakout probability scoring.
Background & History
Many strong market moves begin after a period of reduced volatility. During these quieter phases, price often moves within a narrower range, ATR declines, and Bollinger Bands contract. These conditions are commonly referred to as volatility compression or squeeze conditions.
Breakout traders often monitor these compressed periods because markets can transition from quiet conditions into fast directional movement. Gold, NASDAQ, and forex session breakouts are common examples where volatility compression can appear before a stronger expansion phase.
The Volatility Expansion Predictor brings these concepts together by measuring current compression levels and comparing historical compression behaviour with later ATR expansion. The result is a probability-based tool designed to help traders identify when the market may be preparing for a larger move.
How the Indicator Works
The indicator analyses two primary forms of volatility compression. ATR compression compares the current Average True Range against a recent ATR baseline, while Bollinger Band contraction compares the current band width against its recent average. When both conditions suggest reduced volatility, the Volatility Expansion Score rises.
The indicator also reviews historical compression periods and measures how often those conditions were followed by ATR expansion within a selected number of bars. This generates the Breakout Probability line, which helps traders judge whether current compression conditions have historically led to expansion.
When the expansion probability rises above the selected threshold, the indicator plots an Expansion Signal. These signals do not predict whether price will break upward or downward; they only indicate that volatility expansion risk may be increasing.
Key Features
The Volatility Expansion Predictor gives traders a structured way to identify squeeze conditions and potential breakout environments without manually comparing ATR and Bollinger Band behaviour.
- Detects ATR compression using recent volatility baselines.
- Measures Bollinger Band contraction and squeeze conditions.
- Calculates a Volatility Expansion Score from 0 to 100.
- Displays historical Breakout Probability as a separate line.
- Highlights Compression Zones and Expansion Signal conditions.
- Includes adjustable sensitivity, scoring, probability, and alert settings.
- Works across all symbols and timeframes supported by cTrader.
How to Use it for Trading
This indicator is best used as a breakout-preparation and market-condition tool. A rising Volatility Expansion Score suggests that the market is becoming compressed, while a rising Breakout Probability line suggests that similar historical compression conditions have often led to later ATR expansion.
The indicator can be useful before major trading sessions, during quiet consolidation periods, or when monitoring markets known for explosive breakouts such as gold, NASDAQ, and active forex pairs. Traders may use the indicator to prepare for potential breakout conditions, then wait for price action, market structure, volume, or confirmation of support and resistance before entering a trade.
The indicator should not be used as a standalone buy or sell signal. It identifies volatility conditions, not direction. A high expansion probability can appear before bullish moves, bearish moves, or false breakouts.
Complementary Indicators
The Volatility Expansion Predictor works well with indicators that help confirm direction, trend context, and breakout quality.
- Support and Resistance indicators, to identify breakout levels.
- Market Structure indicators, to confirm directional bias.
- Average True Range, to validate volatility expansion after compression.
- Bollinger Bands, to visually confirm squeeze and expansion behaviour.
- Volume indicators, to confirm participation during breakout attempts.
- Moving Averages, to assess broader trend direction.
Inputs & Parameters
Use these settings to control ATR compression, Bollinger contraction, scoring behaviour, probability analysis, and alert notifications.
| Parameter |
Default/Type |
Description |
| ATR |
|
ATR squeeze and compression settings. |
| ATR Period |
14, int |
Period used to calculate Average True Range. |
| ATR Baseline Lookback |
100, int |
Number of bars used to calculate the recent ATR baseline. |
| ATR Compression Sensitivity |
0.70, double |
Controls how sensitive the indicator is to ATR compression conditions. |
| Bollinger |
|
Bollinger Band contraction settings. |
| Bollinger Period |
20, int |
Period used to calculate the Bollinger Bands. |
| Bollinger StdDev |
2.0, double |
Standard deviation multiplier used for Bollinger Band width calculations. |
| Band Baseline Lookback |
100, int |
Number of bars used to calculate average Bollinger Band width. |
| Band Compression Sensitivity |
0.70, double |
Controls how sensitive the indicator is to Bollinger Band contraction. |
| Scoring |
|
Controls the volatility expansion score and compression threshold. |
| Score ATR Weight |
0.50, double |
Controls the balance between ATR compression and Bollinger contraction in the score. |
| History Lookback Bars |
500, int |
Number of historical bars used to evaluate previous compression and expansion behaviour. |
| Compression Threshold |
70.0, double |
Minimum score required before a compression zone is displayed. |
| Signals |
|
Controls breakout probability signal behaviour. |
| Expansion Threshold |
70.0, double |
Breakout probability level required before an expansion signal is displayed. |
| Probability |
|
Historical breakout probability settings. |
| Expansion ATR Multiple |
1.30, double |
ATR increase required to classify a historical compression period as a successful expansion. |
| Expansion Detection Bars |
10, int |
Number of bars used to check whether expansion followed a historical compression period. |
| Alerts |
|
Controls alert behaviour. |
| Show Alerts |
false, bool |
Plays an alert sound when expansion probability conditions are met. |
Logic Explanation
The indicator combines ATR and Bollinger Band behaviour to identify periods where volatility is compressed. It then compares historical compression events with later ATR expansion to estimate breakout probability.
ATR Compression
Compares current ATR against a recent ATR baseline to identify unusually low volatility conditions.
Bollinger Band Contraction
Measures Bollinger Band width against recent average width to detect squeeze behaviour.
Volatility Expansion Score
Combines ATR compression and Bollinger contraction into a score from 0 to 100.
Historical Breakout Probability
Reviews previous compression periods and calculates how often they were followed by ATR expansion.
Expansion Signal
Plots a signal when breakout probability exceeds the selected expansion threshold.
Advantages
The indicator helps traders identify volatility compression before potential breakout conditions develop. By combining ATR squeeze behaviour, Bollinger contraction, and historical probability, it provides a structured way to monitor markets that may be preparing for larger moves.
Disadvantages
The indicator does not predict breakout direction and cannot guarantee that compression will lead to a profitable move. Volatility can remain compressed for extended periods, and false breakouts can occur. It should be used with price action, support and resistance, session timing, and risk management.
How To Install & Remove
First, ensure the cTrader trading platform is installed. Then unzip the file and double-click it to install automatically.
Built with Xen AI
This cTrader Volatility Expansion Predictor was created using Xen AI, the AI coding assistant from ClickAlgo, to build cTrader indicators, cBots, plugins, dashboards, and trading tools from plain English prompts.
Watch the video to see how Xen AI helped build this indicator from concept to working cTrader code.
New users can start with free credits and test Xen AI before upgrading. Learn more about Xen AI free credits.


