Indicator Overview
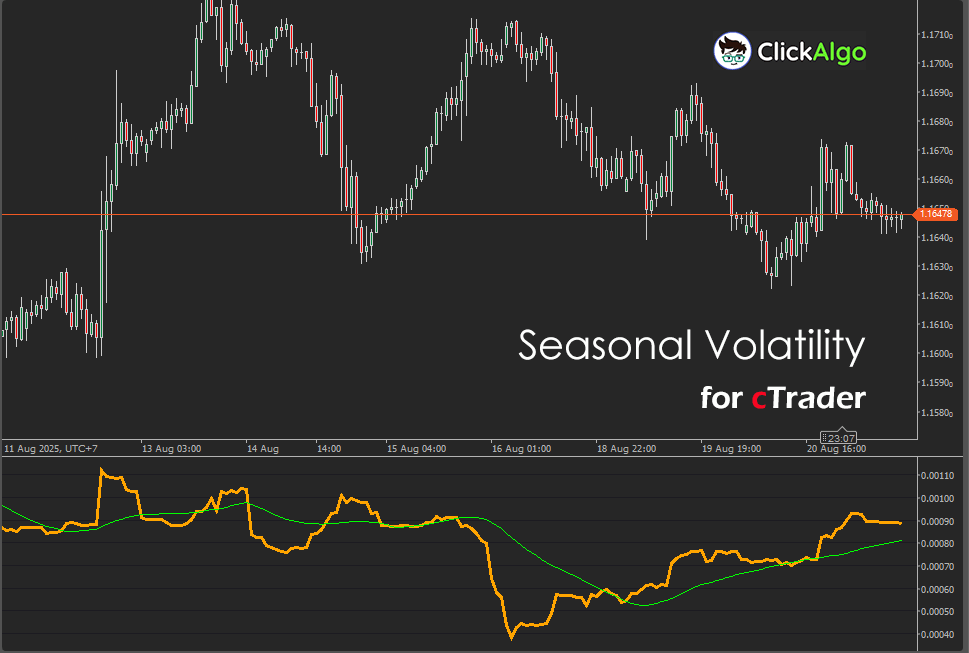
This indicator calculates volatility as the standard deviation of close-to-open price differences over a user-defined lookback period. It then builds a seasonal profile by tracking a rolling average of that volatility for each calendar month. The result is two lines: a fast Volatility line that reacts to current conditions, and a Seasonal Average line that reflects the typical level for the current month.
Background & History
Seasonality studies show that markets often display recurring behaviour tied to calendar effects, from earnings cycles and tax deadlines to holiday periods and commodity harvest seasons. Rather than modelling price direction, this tool focuses on the magnitude of movement, using a simple dispersion metric and comparing it against month-based norms.
How the Indicator Works
On every bar, the indicator measures intrabar change as Close − Open for the last Period bars, computes its standard deviation, and plots that as Volatility. It simultaneously updates a month-specific rolling average of that volatility and plots it as the Seasonal Average for the current month.
-
Highlights when today’s volatility is above or below the typical level for this month.
-
Uses a rolling window per month to keep the seasonal line adaptive.
-
Works on any timeframe and symbol since it uses raw price differences by default.
Key Features
You get a fast snapshot of current volatility versus a month-aware baseline so that you can adapt risk and tactics without guesswork.
-
Two plots, current Volatility and month-specific Seasonal Average.
-
Simple, transparent calculation, easy to validate.
-
Suitable for timing breakout versus mean-reversion tactics.
-
Non-overlay panel for clean chart layouts.
How to Use it for Trading (at a glance)
Use the gap between Volatility and Seasonal Average as context. When Volatility rises meaningfully above the seasonal line, favour breakout, momentum, or wider-stop strategies. When it sits below the seasonal line, consider mean-reversion, range tactics, or tighter stops. Combine with your trend filter or session rules to avoid news-driven outliers.
Inputs & Parameters
These settings control the volatility lookback and reserve a future smoothing control.
| Parameter |
Default / Type |
Description |
| Inputs |
| Period (Days) |
30 (int) |
Lookback length in bars for volatility calculation based on Close − Open differences. |
| Smoothing |
5 (int) |
Reserved for optional smoothing of the seasonal profile in future updates. |
Formulas
Below is a faithful, code-accurate description of the computation.
1) Intrabar change series (last Period bars):
Δi = Close[t − i] − Open[t − i], for i = 0 … Period − 1.
2) Mean and variance of changes:
μ = (1 / Period) · Σi=0..Period−1 Δi
Var = (1 / Period) · Σi=0..Period−1 (Δi − μ)2
3) Current volatility (plotted as “Volatility”):
σ(t) = √Var.
4) Month index and rolling slot:
m = Month(OpenTime[t]) − 1 (0 = Jan … 11 = Dec)
k = t mod Period.
5) Update the month bucket and compute the seasonal average (plotted as “Seasonal Average”):
Bucket[m][k] ← σ(t)
SeasonalAvg(t) = (1 / Period) · Σj=0..Period−1 Bucket[m][j].
Advantages
Fast, transparent, and easy to interpret, this indicator shows whether current conditions are abnormally active or unusually quiet for the current month. It helps align risk controls with regime, improves stop and target placement, and guides the choice between momentum and mean-reversion tactics without overfitting.
Disadvantages
Because it uses raw price differences, the absolute scale varies between symbols and timeframes, and early samples in a new month can be influenced by partially filled buckets. Shocks and structural changes can also break historical seasonal patterns, so treat the seasonal line as context, not a signal on its own.
How To Install & Remove
First, ensure that you have the cTrader trading platform installed. Then, unzip the file and double-click it to install the platform automatically.
Need Extra Help?
Get instant answers with cTrader Sensei — our free AI assistant built for the cTrader platform. It can explain the indicator settings, suggest trading strategies, and guide you step-by-step through this indicator. Rated 4.9 out of 5 in the ChatGPT Store.
Chat with cTrader Sensei
Prefer human help? Visit our support forum where our team and community can assist you.
Note: cTrader Sensei runs on OpenAI's ChatGPT platform. To use it, you will be asked to create a free OpenAI account. Registration is quick and costs nothing.
The free version works immediately, but upgrading to a ChatGPT Plus subscription unlocks the latest GPT model, which provides more accurate and detailed answers for trading, coding, and product support.
To upgrade, log in to ChatGPT, click your profile in the bottom left, and select Upgrade to Plus.
Need a Broker
If you're still looking for a broker with tight spreads and fast execution, visit our top cTrader broker site.


