cTrader Harmonic Butterfly Pattern
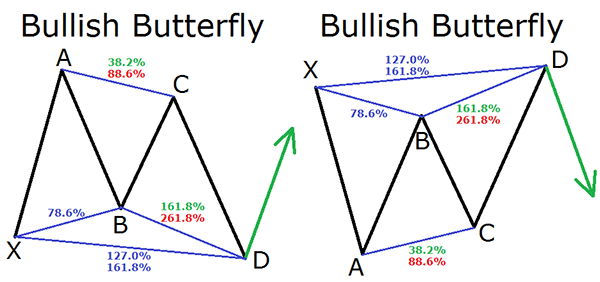
The Butterfly formation is an extension pattern that forms part of the group of Harmonic patterns that use Fibonacci numbers. It is a reversal pattern that can usually be found at the end of a trend move and the formation consists of five legs marked X, A, B, C, and D. This type of indicator will help you identify when the current price move is approaching its end which will tell you to enter the market as the price reverses direction.
Harmonic patterns are becoming increasingly popular in Forex trading.

Forex Traders can use the Butterfly pattern to pinpoint the end of a trending move and in Elliott wave terms you will see this pattern during the last wave (5) of the impulse sequence. The Butterfly pattern has four price swings or legs, you will find that its appearance on the chart matches the letter M with a downtrend and a letter W with an uptrend. While the pattern is forming it is can sometimes be mistaken for a Double Top or Double Bottom pattern.
X - A Leg
This is the initial move that forms that pattern and no special rules are required, but with the bearish pattern, you will see the first leg forms when the price falls sharply from point X to point A.
A - B Leg
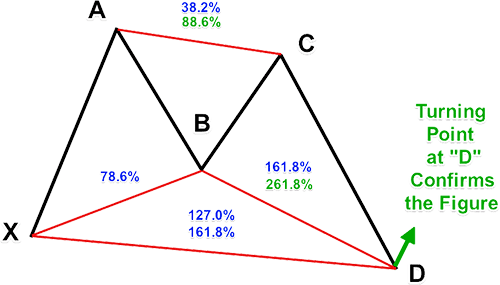
When the A-B leg is formed it will see the price change direction and retrace to 78.6% of the distance covered by the X-A leg. Point B is the most important level for the butterfly pattern for the retracement of 78.6%.
B - C Leg
When the B-C leg is formed it will see the price change direction again and moves back down, the BC move should take the 38.2% or the 88.6% retracement of the AB move.
C - D Leg
This is the final and most important of all the moves and the final pattern that is formed. If BC leg is around 38.2% of AB leg then this final CD leg is anticipated to reach the 161.8% extension of BC, but sometimes if the BC leg is 88.6% of AB, then the CD leg is likely to reach the 261.8% extension of BC.
Butterly Pattern Hot-Tips
The perfect butterfly pattern should have the following key elements shown below:
- An ABCD or an extension of this pattern must be formed.
- Leg XA must have a Fibonacci extension of around 127%.
- Leg BC must have a Fibonacci extension of between 161.8% to 261.8%.
How to Trade using the Harmonic Butterfly Pattern?
When leg D is formed the pattern is complete and ready to use for trading. The image below shows a bullish butterfly pattern which has formed and at point D the price has a high probability of turning bullish and going up. The opposite would be the same for a Bearish butterfly pattern.

Bearish Butterfly Pattern Trade Example
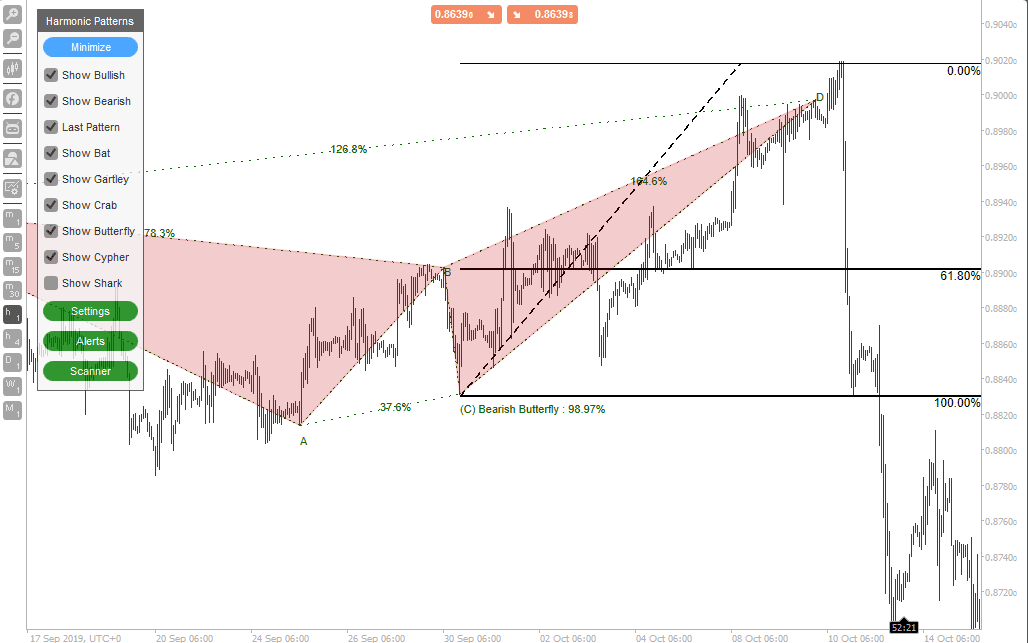
The image below shows a perfect trade setup using the Harmonic Pattern Recognition software for the bearish butterfly pattern, a short position would be opened with stops above the 0% level of the Fibonacci Retracement Tool and the 1st profit target will be at the golden ratio of 61.8%, followed by target 2 at 100% retracement.

This example is not a perfect Butterfly pattern but uses an accuracy of 98.97% of the Harmonic Pattern Detector
Harmonic Pattern Trading
An advanced trading method like harmonic trading uses pure price action which has a determined system for price pattern recognition and Fibonacci techniques which cover the Harmonic Trading approach.


