cTrader Doji Candlestick Pattern
A cTrader doji candlestick is a major signal in technical analysis when trading using cTrader. It forms when the prices finish very close to the same level so that the body is very small or not visible. There are four different types of doji candlesticks that are formed which are the common long-legged, dragonfly and gravestone.
What is The Doji Pattern?
The doji candlestick pattern represents a supply & demand equilibrium or a tug-of-war between the bears and the bulls and the end result was no winner. When there is an uptrend the bulls are winning and in a downtrend, the bears are winning, when the price ends up at the same spot, there were no winners or losers, so nobody has control.
"Even though the doji pattern is very powerful, do not trade with pattern alone, but always wait for the next candlestick to confirm your suspicions before taking action."
How to Trade with a Doji
After a long uptrend where the bulls have been in control, the appearance of a doji candlestick can be a warning sign that the trend has peaked and will soon change direction to bearish. After a strong trend in either direction, they usually signal major turning points. Always recognize the doji when it occurs, and be prepared to take appropriate action.
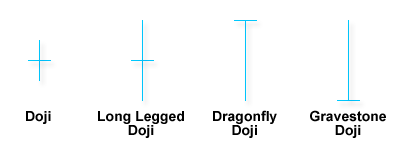
Different Types of Doji Patterns
There are 4-types of doji patterns which are shown below and they all signal different types of trend reversals.
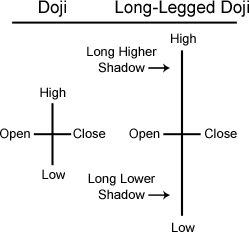
Neutral Doji
A doji is a type of neutral candlestick for an instrument where the open and close prices are virtually equal. Neutral doji candlesticks look like a cross, inverted cross or plus sign.
Long Legged Doji
The long-legged doji is a candlestick pattern that consists of long upper and lower shadows and has practically the same opening and closing price. These candlesticks are most significant when they occur during a strong up or downtrend. A long-legged doji suggests that the forces of supply and demand are nearing equilibrium.
Dragonfly Doji
The dragonfly doji is interpreted as a bullish reversal candlestick pattern that mainly occurs at the bottom of downtrends. The Dragonfly Doji is created when the open, high, and close are the same or about the same price and there is a long shadow below the body as shown in the diagram above.
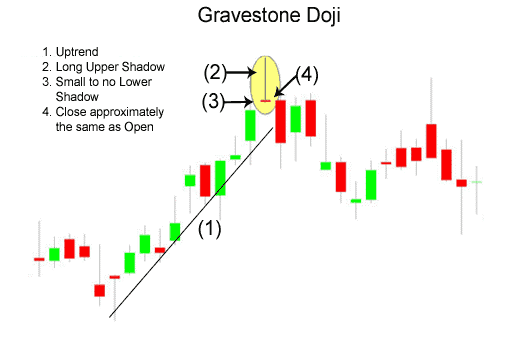
Gravestone Doji
A gravestone doji is a bearish reversal candlestick pattern that is formed when the open, low, and closing prices are all near each other with a long upper shadow. The long upper shadow shows that the bulls at the beginning of the session were overcome by bears by the end of the session.
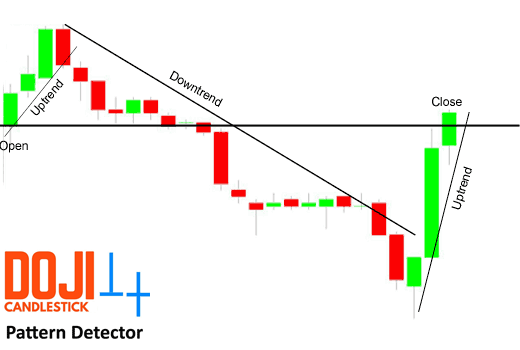
Lower Timeframe Breakdown of the Doji
In the diagram below shows a single session on a lower timeframe where the open and close price of an instrument ended up the same, on the higher timeframe you would have seen just a neutral doji as shown above, this shows that no one won the battle between the bulls and the bears.
Doji Pattern Detection Software?
Take a quick look at the cTrader Doji Candlestick Detector Indicator, this indicator will automatically identify Doji trade setups and send alerts.

Customer Rating 4.5 / 5
Based on verified reviews from our store.

