cTrader Fibonacci Retracement Tool
When used with the cTrader platform, the term Fibonacci retracement is a charting tool that uses technical analysis to identify support or resistance levels with the use of percentage values. The Fibonacci retracement levels use lines to show where the possible support and resistance levels are located. The actual percentage values show how much of a previous price move has retraced.
Some of the common Fibonacci retracement levels used by the tool are:
- 23.6%
- 38.2%
- 61.8% - The golden ratio that repeats itself in the universe and everyday life
- 78.6%
- 50% is also used, but not a common Fibonacci value.
The Golden Ratio
The Golden ratio is a special number found by dividing a line into two parts so that the longer part divided by the smaller part is also equal to the whole length divided by the longer part. It is often symbolized using phi, after the 21st letter of the Greek alphabet. The equation is shown below:
a/b = (a+b)/a = 1.6180339887498948420 …
1.618 inverse equals 0.618 or 61.8%
Fibonacci 101
If you are new to Fibonacci numbers and would like some background information and knowledge then just follow the links below, once you have read these articles please come back to this page to continue learning how to use the cTrader retracement tool.
- What are Fibonacci numbers?
- Fibonacci Numbers & Lines Explained
- How to use the Fibonacci Extension Tool
Where To Find This Tool on cTrader?
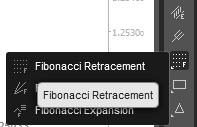
You can find this tool when you have the cTrader platform open by looking at the charting toolbar which is usually located on the right-hand side of the chart as shown below. You simply click on the name and an icon will appear replacing the mouse cursor, you then click and snap the tool onto the highest high and lowest low price values to get the tool to automatically snap to these points and draw the retracement tool.
How To Use This Tool
First, you identify if it is an uptrend or downtrend, if the price is on an uptrend for the timeframe you are using then you select the retracement tool, click your mouse on the highest point and then click your mouse the 2nd time on the lowest point, you should then see the tool on the chart showing all the Fibonacci lines with their percentages.
Once the indicator has been painted on the chart you will find that all the Fibonacci levels are fixed and will not change and the percentage levels shown are the areas where the price could reverse.
The Fibonacci lines show key levels of resistance and support. This tool is best used when the markets are trending up or down.
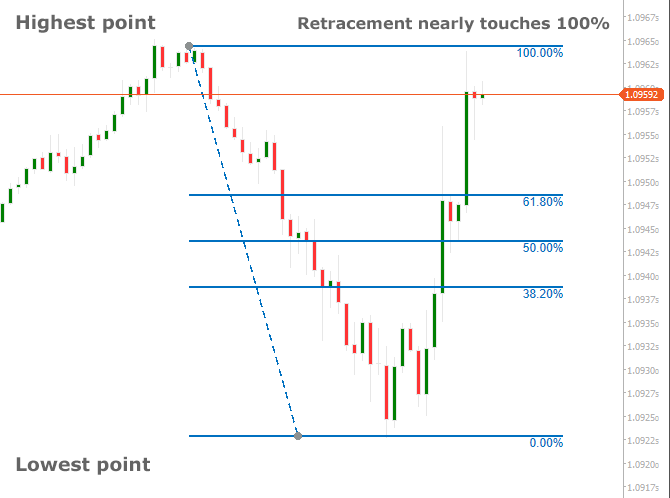
The image above which is for the EURUSD shows that the price was on an uptrend until it reached the highest point where it hot some resistance, it then retraced to the lowest point to a strong support level and started a bullish retracement, when this happened we had two distinct high and low points. The retracement tool was used with these high and low points showing 0% as the beginning and 100% as the previous high point.
The 50% Retracement Level
The 50% retracement level is generally included in the Fibonacci grid that can be drawn applying the cTrader charting tool and since the 50% retracement level is not based on any precise Fibonacci number it is generally viewed as an important reversal level.
Some Example Trade Placements
The cTrader Fibonacci retracement tool can be used to place market orders, determine stop-loss levels and set price targets. The idea is to buy on a retracement at a Fibonacci support level when the market is trending bullish and to sell on a retracement at a Fibonacci resistance level when the market is trending bearish.
Here are some examples of which Forex strategies traders often apply when using Fibonacci levels:
- Place an order near the 38.2% retracement level, with a stop-loss order placed a little below the level of 50%.
- Plan an order around the 50% level, with a stop-loss order established slightly below the level of 61.8%.
How To Use The cTrader Fibonacci Retracement Tool
Duration: 6 minutes
Advanced Charting Tools
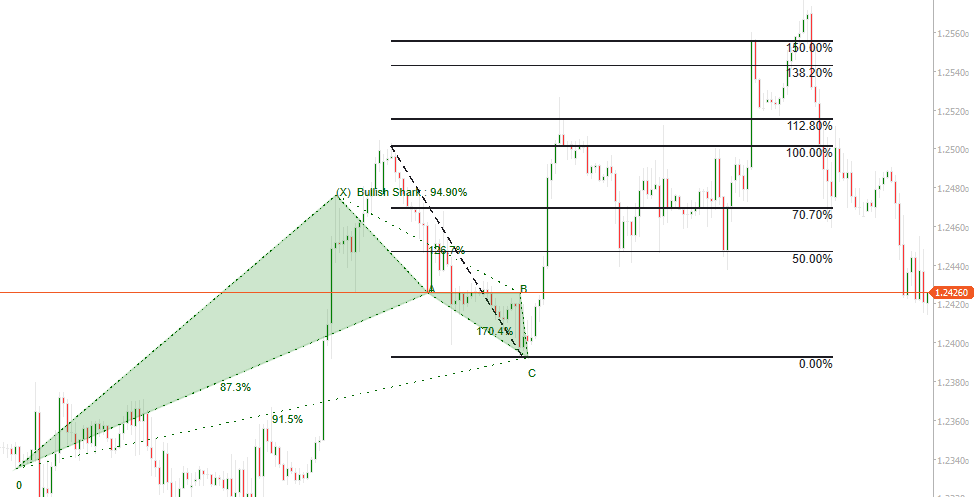
The Fibonacci Retracement tool works very well when used with the cTrader Harmonic Pattern Recognition Software. Using the cTrader Harmonic Pattern Scanner together with the Support & resistance indicator and the Risk & Reward Tool will give you the best combination to trade affectively.
If you are new to Harmonic Patterns which is used for advanced technical charting then you may want to learn more.

Customer Rating 4.5 / 5
Based on verified reviews from our store.

