cTrader Fibonacci Extension Tool
The Fibonacci extension tool or expansion tool as it is known with cTrader is used by traders so they can establish profit targets or determine how far a price may travel after a price retracement or pullback has finished and the extension levels are possible areas where the price may reverse.
You can use the Fibonacci Expansion tool in all markets and on all time frames, it is a trend-following tool and helps separate potential profit targets for potential trades. It is also used to spot areas where the price may reverse, but this is not advised. You may find that the price may not stop exactly at a Fibonacci level and that the Fibonacci levels are just a guide.
~ The Fibonacci extensions show how far the next price wave could move following a pullback ~
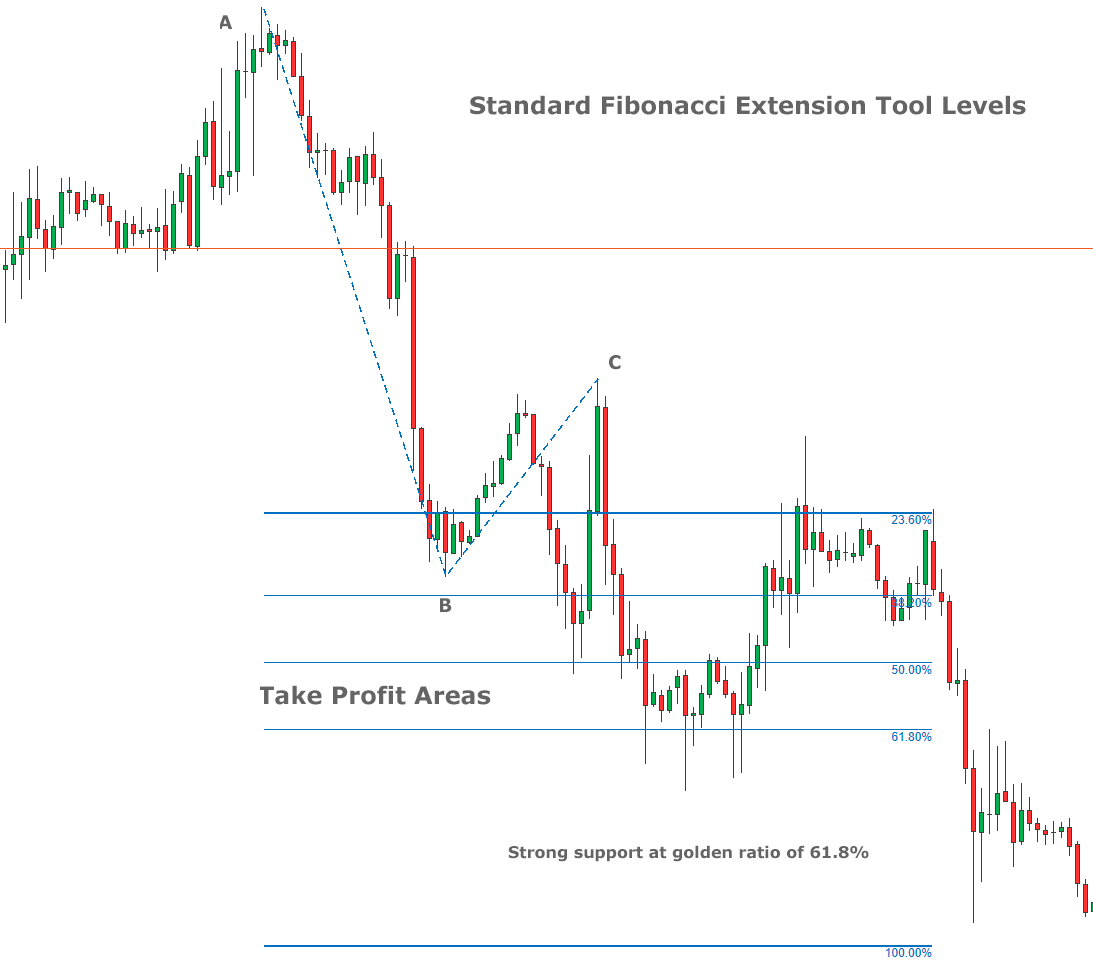
The chart below shows the Euro Dollar on a 1-hour timeframe on a bearish trend, the expansion tool was used to try and predict the next possible reversal level, each of the lines from the Fibonacci Tool show possible support areas.
How To Use This Tool - Bearish Trend
You can define the Fibonacci extension levels by using just three mouse clicks.
Method #1 - Standard
If you have identified a bearish trend down then you select the tool and click on your mouse on the previous high point (last swing high), then you click on the mouse identifying the lowest point (last swing low). Once you have selected the high and low points you just click the mouse on the highest point of the last retracement and the extension support levels will automatically be drawn on the chart as shown above.
The Golden Ratio
The Golden ratio is a special number found by dividing a line into two parts so that the longer part divided by the smaller part is also equal to the whole length divided by the longer part. It is often symbolized using phi, after the 21st letter of the Greek alphabet. The equation is shown below:
a/b = (a+b)/a = 1.6180339887498948420 …
1.618 inverse equals 0.618 or 61.8%
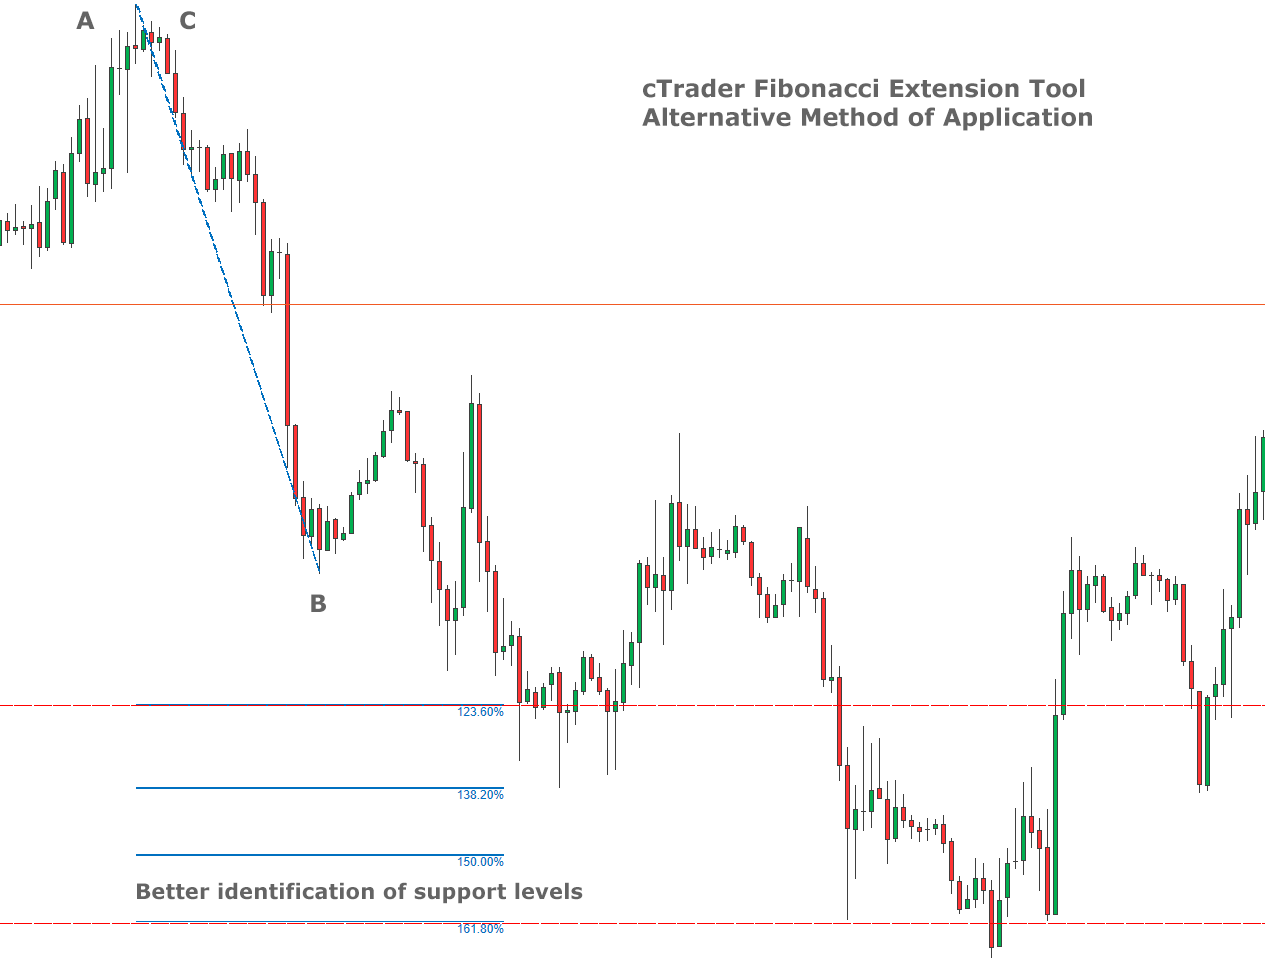
Method #2 - Advanced
Many traders do not use the method above to identify extension levels, but instead, the last leg is not the last extension as shown in C above, but rather to the starting leg of A. So it will go from the last highest high point (A) to the last lowest low point (B) and then back up to the highest high again (A). This method uses different ratio levels which are shown below.
Alternative Ratios
Use the cTrader Fibonacci expansion tool to provide profit targets on trending trades, if you find you have slowing or weak trends then 61.8% level tends to work best. For solid trends, you will find the 100% level is good and for stronger trends the 161.8% or higher targets are adequate.
These are very important Fibonacci extension levels:
- 123.6%; 138.2%, 150.0%, 161.8%, and 261.8%.
These Fibonacci Expansion levels are attained by finding relationships between the numbers in the Fibonacci sequence.
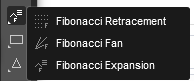
Where To Find This Tool on cTrader?
You can find this tool when you have the cTrader platform open by looking at the charting toolbar which is usually located on the right-hand side of the chart as shown below. You simply click on the name and an icon will appear replacing the mouse cursor, you then click and snap the tool onto the highest high and lowest low price values to get the tool to automatically snap to these points and draw the retracement tool.
How To Use The cTrader Fibonacci Expansion Tool
Duration: 7 minutes
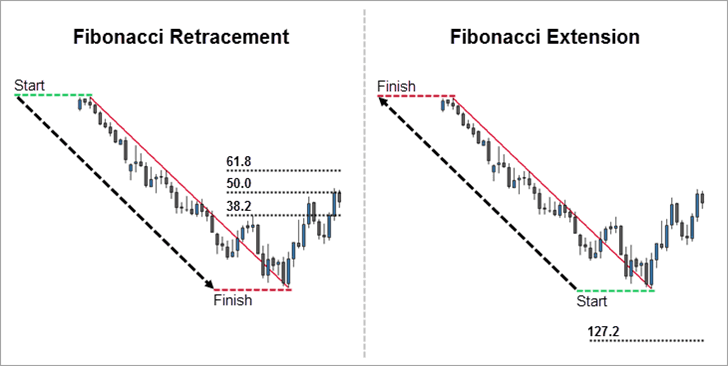
What's The Difference Between the Fibonacci Retracement & Expansion Tool?
While Fibonacci extensions tool shows where the price will go following a retracement, the Fibonacci retracement tool shows levels of how deep a retracement could go, so the Fibonacci retracements tool measures the pullbacks while the Fibonacci extension tool measures the impulse waves in the direction of the trend.
Fibonacci Retracement Tool
This tool is available with the cTrader platform as a standard tool, it is very useful when used together with Harmonic Patterns, this charting tool uses technical analysis to identify support or resistance levels with the use of percentage values.

Customer Rating 4.5 / 5
Based on verified reviews from our store.

