How to Build a Simple Moving Average Strategy
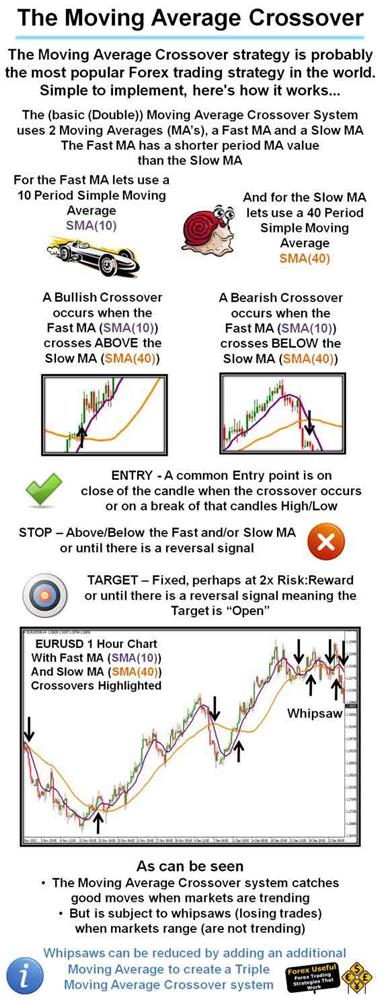
A crossover is the most basic type of signal and is favoured among many traders because it removes all emotion. The most basic type of crossover is when the price of a symbol moves from one side of a moving average and closes on the other. A Bullish Crossover occurs when the Fast MA crosses ABOVE the Slow MA and a Bearish Crossover occurs when the Fast MA crosses BELOW the slow MA.
"The Moving Average Crossover strategy is probably the most popular Forex trading strategy in the world"
In this video we will show you a code walkthrough from a pre-built automated strategy that opens and closes positions when two simple Moving Average values cross each other to signal a bullish or bearish trend, we also describe how to back-test and verify the logic of the robot and to pick out any strange anomalies that may occur.
Simple Moving Average Formula
The simple moving average (SMA) is the most basic of the moving averages used for trading. The simple moving average formula is calculated by taking the average closing price of a stock over the last "x" periods. Let's take a look at a simple moving average example with MSFT. The last five closing prices for MSFT are:
28.93+28.48+28.44+28.91+28.48 = 143.24
To calculate the simple moving average formula you divide the total of the closing prices and divide it by the number of periods.
5-day SMA = 143.24/5 = 28.65
Alternative Code Block for the Crossover Signal
The following code may be more suitable for the crossover check, it functions better also for the first trade so that it opens only when the crossover occurs.
if (_sma1.Result.HasCrossedAbove(_sma2.Result.LastValue, 0))
or
if (_sma1.Result.HasCrossedBelow(_sma2.Result.LastValue, 0))
Watch a Video Tutorial
We have also recorded a video on YouTube to help you.

ONE OF THE LIMITATIONS OF THIS STRATEGY
The Moving Average Crossover system catches good moves when the markets are trending, but is subject to whipsaws (losing trades) when the market is in a range (no trend), but this can be corrected using other indicators.


