Indicator Overview
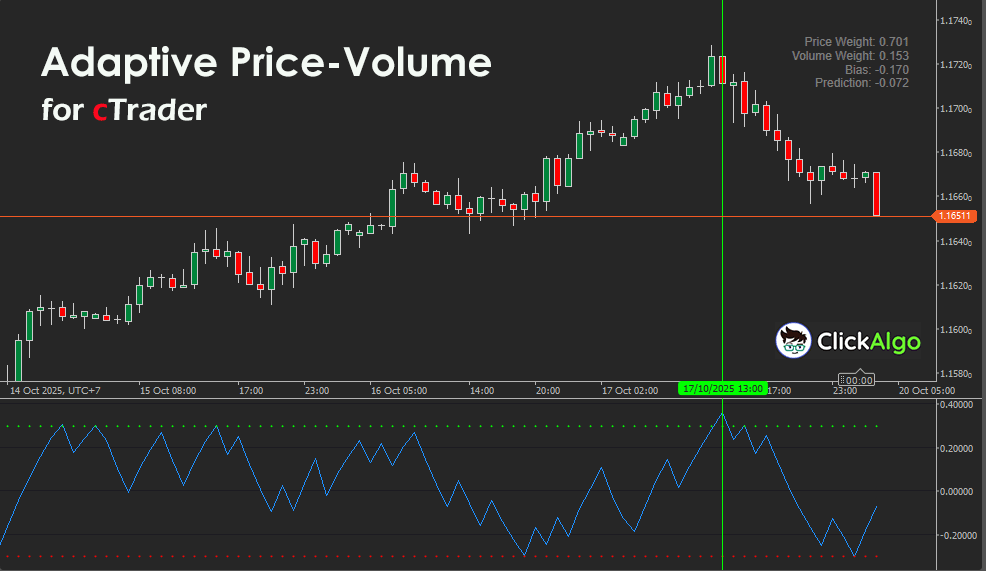
This indicator analyses both price and volume data in real time to generate an adaptive signal that reacts to shifts in market behaviour. The output is a single predictive line plotted in a subwindow with upper and lower threshold levels. Crossovers of these thresholds indicate potential trade opportunities, allowing traders to observe where activity in price and volume align.
Background & History
Traditional volume or momentum indicators focus on either price or volume alone. This tool evolved from the idea of merging both datasets into a simplified adaptive model that updates its internal balance between price and volume influence as new data arrives. It provides a practical way to study their joint effect without requiring complex statistical or machine learning systems.
How the Indicator Works
The indicator computes percentage changes in both price and tick volume between consecutive bars. It maintains a rolling list of recent changes defined by the Lookback parameter and calculates average values. Using adaptive weighting, it updates internal coefficients for price and volume based on the observed error between actual and predicted direction. The resulting prediction is smoothed using a hyperbolic tangent function (tanh) to remain bounded between −1 and +1.
Threshold lines at ±Threshold help detect crossovers. When the prediction crosses above the upper line, a bullish condition is signalled. When it drops below the lower line, a bearish condition occurs. The indicator can optionally send a Telegram or message-box alert at these points.
Key Features
-
Combines price and volume changes into a single adaptive signal.
-
Displays dynamic buy and sell thresholds.
-
Adjustable learning rate and weight settings.
-
Supports Telegram and in-platform message alerts.
-
Non-overlay display for easy comparison with other oscillators.
How to Use it for Trading
Traders use the Adaptive Price Volume Indicator to confirm market direction by observing threshold crossovers.
-
A Buy signal occurs when the blue signal line crosses above the upper green threshold.
-
A Sell signal occurs when it crosses below the lower red threshold.
-
The further the signal moves away from zero, the stronger the directional momentum.
It can be combined with trend-following indicators such as moving averages to filter trades in the dominant trend direction. Beginners should first run it in demo mode to observe how the signal responds to volatile or low-volume periods before applying it live.
Complimentary Indicators
The Adaptive Price Volume Indicator can be combined with several other tools to refine trade entries and reduce false signals. These combinations help confirm direction, validate momentum strength, and identify optimal timing.
-
cTrader Volume Heatmap Overlay. Shows where trading activity concentrates across price levels, allowing traders to confirm that a signal occurs near strong volume zones.
-
cTrader RSI Divergence Indicator. Helps validate when adaptive buy or sell signals align with momentum reversals, reducing noise during range conditions.
-
cTrader Trend Strength Meter. Provides a higher-timeframe directional filter so traders only take adaptive signals in the dominant trend direction.
-
cTrader Smart Break-Even Manager cBot. Can automatically secure profits once an adaptive signal trade moves favourably, improving overall risk control.
-
cTrader Equity Curve Protector cBot. Adds portfolio-level protection by pausing trading if multiple adaptive signal trades turn unprofitable.
Using these complementary tools together allows traders to combine dynamic signal generation with trend confirmation, volume validation, and automated protection for a more structured trading approach.
Telegram Alerts
When a signal occurs, the indicator will send a Telegram alert directly to your PC or mobile device.
Inputs & Parameters
The following table lists all user input parameters:
| Parameter |
Default / Type |
Description |
| Lookback Bars |
20 (int) |
Number of bars used for calculating average price and volume changes. |
| Learning Rate |
0.1 (double) |
Adjustment speed for internal weights for each bar. |
| Threshold |
0.3 (double) |
Defines upper and lower signal boundaries for trade conditions. |
| Initial Price Weight |
0.7 (double) |
Starting sensitivity of the model to price changes. |
| Initial Volume Weight |
0.3 (double) |
Starting sensitivity of the model to volume changes. |
| Enable MessageBox Alerts |
False (bool) |
Displays on-screen alerts when signals trigger. |
| Enable Telegram Alerts |
False (bool) |
Sends alerts to a Telegram chat when a buy or sell condition occurs. |
| Telegram Bot Token |
"" (string) |
Your Telegram bot token for sending messages. |
| Telegram Chat ID |
"" (string) |
Destination chat ID for Telegram alerts. |
Formula Explanation
The model generates the prediction using adaptive weight updates and a bounded nonlinear activation.
prediction = tanh( (w_price × avg_price_change) + (w_volume × avg_volume_change) + bias )
error = actual_direction − prediction
w_price = w_price + (learning_rate × error × avg_price_change)
w_volume = w_volume + (learning_rate × error × avg_volume_change)
bias = bias + (learning_rate × error)
Advantages
The indicator reacts quickly to shifts in price–volume behaviour and automatically balances sensitivity without manual recalibration. It helps identify when both price and volume momentum align, providing earlier clues to potential reversals or breakouts.
Disadvantages
It can produce false signals in low-volume or ranging markets where volume changes are irregular. The adaptive nature may also lead to short-term overfitting during volatile periods if the learning rate is too high.
How To Install & Remove
First, ensure that you have the cTrader trading platform installed. Then, unzip the file and double-click it to install the platform automatically.
Need Extra Help?
Get instant answers with cTrader Sensei — our free AI assistant built for the cTrader platform. It can explain the indicator settings, suggest trading strategies, and guide you step-by-step through the use of this indicator. Rated 4.9 out of 5 in the ChatGPT Store.
Chat with cTrader Sensei.
Prefer human help? Visit our support forum where our team and community can assist you.
Note: cTrader Sensei runs on OpenAI's ChatGPT platform. To use it, you will be asked to create a free OpenAI account. Registration is quick and costs nothing.
The free version works immediately, but upgrading to a ChatGPT Plus subscription unlocks the latest GPT model, which provides more accurate and detailed answers for trading, coding, and product support.
Need a Broker
If you're still looking for a broker with tight spreads and fast execution, visit our top cTrader broker site.


