History and Background
The cTrader Balance of Power indicator came from the work of Igor Livshin, who set out to create a tool that could expose the tug-of-war between buyers and sellers inside each candle. It was never meant to be flashy or complicated, just a straightforward way to see who had the upper hand.
Instead of focusing on volume or more complex formulas, this indicator uses price within the candle’s range to reflect market pressure. The idea caught on with traders who were tired of lagging indicators and wanted something that gave a more honest snapshot of the market.
Over time, it became a go-to for those watching for shifts in control, whether buyers are fading or sellers are stepping in, long before it shows up in the trend. It remains a sharp but straightforward tool, especially for price action traders who care more about what's happening than what the math says should happen.
How the Indicator Works
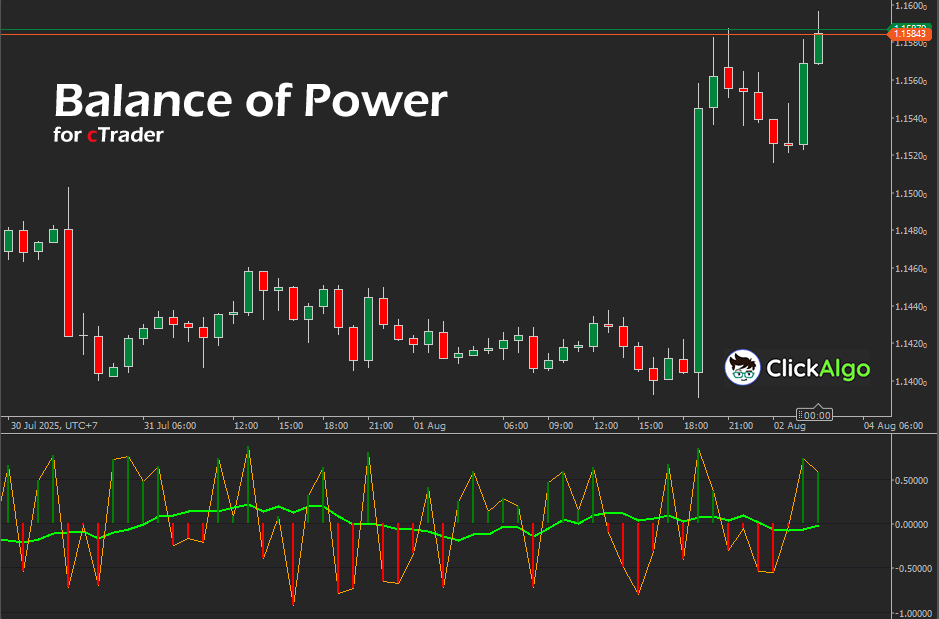
The Balance of Power indicator compares the closing price of a candle to its overall range. If the close is near the high, it suggests buyers were in control during that period. If it's near the low, sellers had the upper hand. These values are normalised and plotted around a centerline, usually zero, so you can quickly see whether buying or selling pressure is dominating. It helps reveal subtle shifts in momentum that might not be obvious just by looking at price alone.
Key Features
-
Clearly shows who is in control, buyers or sellers
-
Plot values above and below zero for quick visual reference
-
Responds directly to price action without relying on volume
-
Helpful in spotting early signs of trend shifts or confirming momentum
-
Works on any timeframe and instrument in cTrader
-
Clean, uncluttered display that integrates easily with other indicators
How to Use It in Trading
The Balance of Power indicator helps you discover market sentiment and find potential reversals & trend confirmations. When the BOP rises above zero, it suggests buyers are in control, which can confirm a bullish move. When it drops below zero, it points to selling pressure.
Sudden surges or dips in the Balance of Power can point to a change in market control, especially when the price is nearing necessary support or resistance zones. Traders often use this as a way to read the mood of the market more clearly. You might look for the indicator to move in step with price to confirm the trend is holding, or watch for it to move the other way when price makes a new high or low; that kind of divergence can be an early sign of a reversal. It also helps filter out false breakouts, giving you more confidence before jumping in. Some traders use a cross above or below the zero line as a simple entry or exit cue, especially when paired with other signals.
It works best when combined with other tools like moving averages or candlestick patterns for added confirmation. It can also be used on its own.
Trading Tips and Considerations
BOP is most useful when combined with support, resistance, or trendlines. It adds clarity to areas where price might reverse or break out.
Watch for divergence
If price pushes to new highs or lows, but BOP does not follow, this can be a sign of weakening momentum and a possible reversal.
Avoid using it in isolation.
Like any momentum indicator, BOP is more effective when paired with other tools, such as moving averages or price action setups.
Adjust for the timeframe.
On lower timeframes, the signal may be more reactive but also noisier. On higher timeframes, signals are slower but more reliable.
Mind the zero line
Movements above or below zero suggest a shift in control, but look for follow-through in price before acting on it.
Balance of Power Formula
BOP = (Close - Open) / (High - Low)
Explanation:
- Close: Closing price of the candle
- Open: Opening price of the candle
- High: Highest price during the candle
- Low: Lowest price during the candle
Key Points:
- The result is a value between -1 and 1, centred around 0
- Values near 1 indicate strong buying pressure
- Values near -1 indicate strong selling pressure
- Values around 0 suggest market indecision or balance
One drawback of the Balance of Power indicator is that it can produce misleading signals in low-volatility or ranging markets, where price movements are limited and the open and close are close together. Since it relies solely on candle structure without volume or broader context, it may overreact to small fluctuations and offer weak confirmation without additional tools.
How To Install & Remove
First, ensure that you have the cTrader trading platform installed. Then, unzip the file and double-click it to install the platform automatically.
Need Extra Help?
Get instant answers with cTrader Sensei — our free AI assistant built for the cTrader platform. It can explain the indicator settings, suggest trading strategies, and guide you step-by-step through this indicator. Rated 4.9 out of 5 in the ChatGPT Store.
Chat with cTrader Sensei
Prefer human help? Visit our support forum where our team and community can assist you.
Note: cTrader Sensei runs on OpenAI's ChatGPT platform. To use it, you will be asked to create a free OpenAI account. Registration is quick and costs nothing.
The free version works immediately, but upgrading to a ChatGPT Plus subscription unlocks the latest GPT model, which provides more accurate and detailed answers for trading, coding, and product support.
To upgrade, log in to ChatGPT, click your profile in the bottom left, and select Upgrade to Plus.
Need a Broker
If you're still looking for a broker with tight spreads and fast execution, visit our top cTrader broker site.


