The Ultimate Oscillator is a technical indicator that was developed by Larry Williams in 1976 to measure the price momentum of an asset across multiple timeframes by using the weighted average of 3 different timeframes the indicator has less volatility and fewer trade signals compared to other oscillators that rely on a single timeframe. this indicator is very special as the signals are produced following divergences. The Williams Ultimately Oscillator will generate fewer divergence signals than other oscillators due to its multi-timeframe system.
This indicator is included with the cTrader trading platform, but this version allows configuration of the cycle periods.
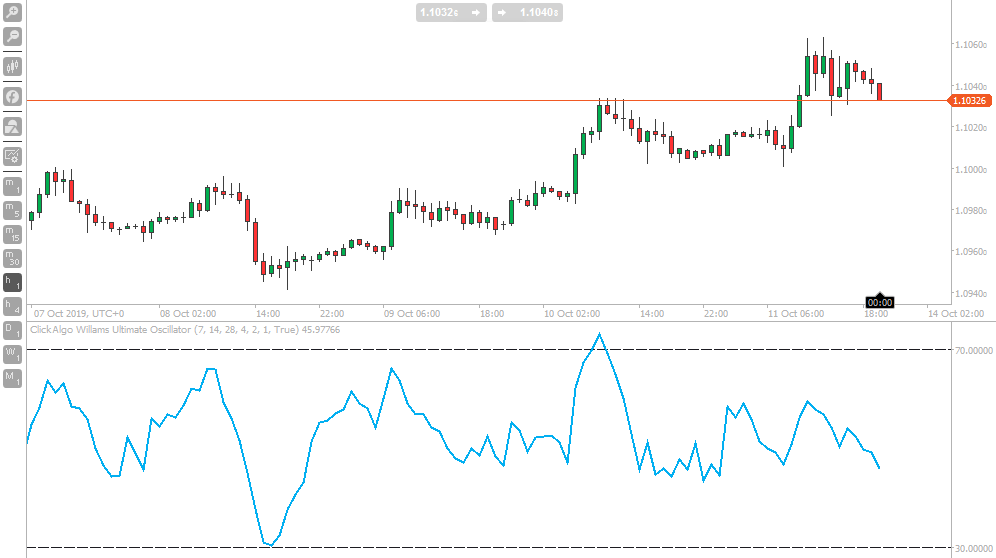
What Does the Ultimate Oscillator Tell You?
The Ultimate Oscillator is a range-bound indicator with a value that fluctuates between 0 and 100, you will find this indicator similar to the Relative Strength Index (RSI) indicator on cTrader. The levels below 30 are considered to be oversold and levels above 70 are considered to be overbought. The Trading signals are formed when the price moves in the opposite direction of the indicator and is based on a 3-step approach.
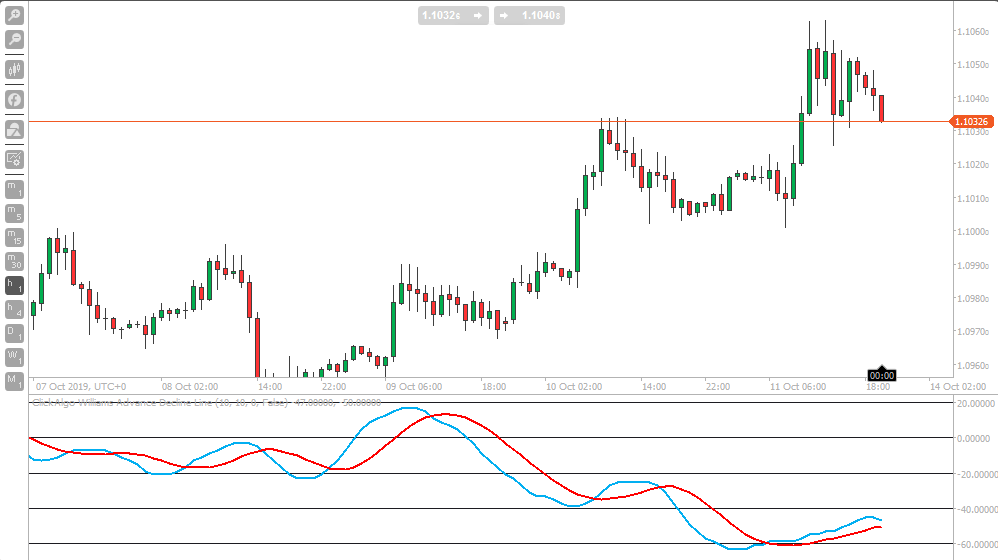
2. Williams Advance/Decline Line
The Williams Advance & Decline line is a technical indicator that plots the difference between the number of advancing and declining stocks on a daily basis. The indicator is cumulative, with a positive number being added to the prior number and if the number is negative it is decreased from the prior number.
What Does the Advance/Decline Line Tell You?
The Williams Advance & Decline line is used to determine the market sentiment or strength in a trend and it will inform traders if more assets are rising or falling. you will find that it is used to confirm price trends and can also warn when reversals or divergence occur.
3. Williams Cycle Identifier
The cTrader Wiliams Cycle Identifier provides buy and sell price action filtered forex signals on the chart, this technical indicator consists of the following nested indicator formulas, the SMA, RSI and a price action filter which filters out most false signals.
How are the signals read?
- A green cycle spike located below the 0.0 level denotes a buy signal
- A red cycle spike located above the 0.0 level denotes a sell signal
Use the Cycle Identifier Signals indicator for:
- Scalping (1-Minute)
- Intraday trading (5-Minute, 15-Minute)
- Swing trading (1-hour, 4-hour and Daily).
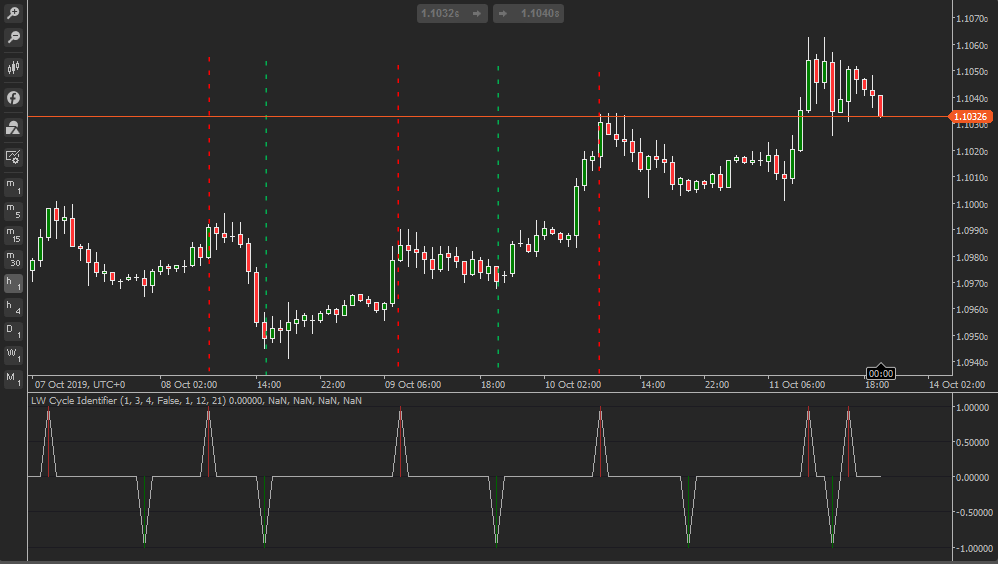
The dotted red & green lines are not displayed by the indicator, but this shows the trend reversals a few bars before the actual trend changes direction.
This indicator repaints with real-time data.
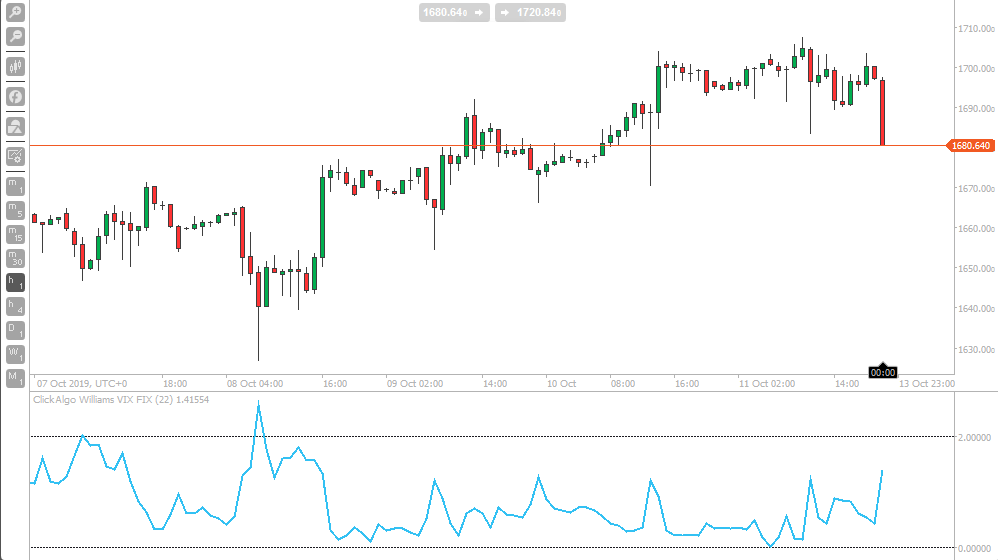
4. Williams VIX FIX
This synthetic VIX calculation was created to replicate the performance of the Chicago Board Options Exchange Market Volatility Index (VIX) which is a well-known indicator that measures the market risk using the implied volatility of the S&P 500 index options.
A high VIX Fix value indicates a high volatility in the underlying security while a low VIX Fix value indicates low volatility in the underlying security. There are several ways to use the Williams VIX Fix in a trading strategy. You can, for example, apply the Bollinger Bands or the stochastic indicator on the VIX Fix for stocks or indices you are analyzing.
4. Williams %R
This indicator is already installed on cTrader as default.
The Williams %R indicator which is also known as the Williams Percent Range is a type of momentum indicator that moves between 0 and -100 and measures overbought and oversold levels. The Williams %R may be used to find entry and exit points in the market. The indicator is very similar to the Stochastic oscillator and is used in the same way. It was developed by Larry Williams and it compares a stock’s closing price to the high-low range over a specific period, typically 14 days or periods.
How To Install & Remove
First, make sure you have the cTrader trading platform installed and then unzip the file and double-click on it to automatically install it onto the platform.
Any Questions?
If you have any questions, please first search our product help forum for the answer, and if you cannot find it, post a new question.
Need a Broker
If you are still looking for a broker you can trust, look at our best cTrader broker site.
Need Coding Help?
If you need help creating your very own customised automated trading system, contact our development team for a quote.


