Indicator Overview
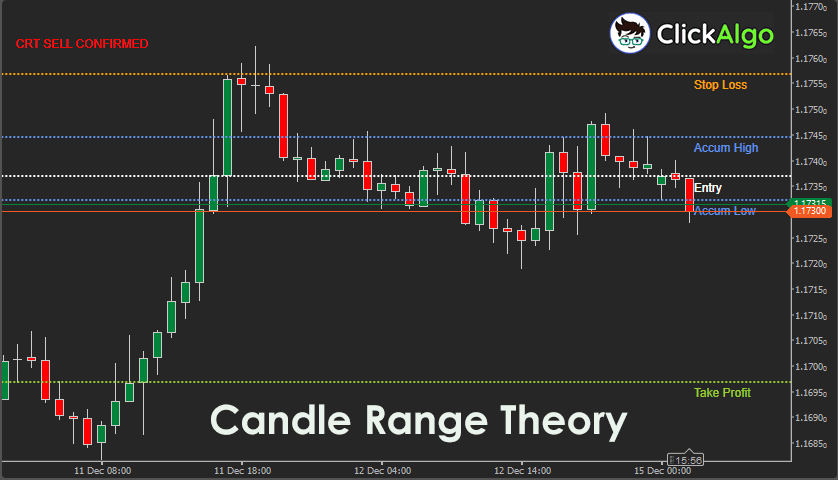
The Candle Theory Range Indicator applies a rule-based framework to interpret how price behaviour changes within defined accumulation ranges. It analyses higher-timeframe candles to identify where price has consolidated, then monitors lower-timeframe price action for manipulation that moves outside that range. Once a false break is detected, the indicator waits for structured confirmation before producing a directional signal. All key levels are automatically drawn, including accumulation boundaries, entry price, stop-loss, and take-profit levels. Visual elements can be displayed as lines or shaded zones, making the indicator adaptable to different trading styles. It is designed to work on any liquid market and integrates cleanly with existing chart layouts.
i
This indicator combines higher-timeframe accumulation analysis, manipulation detection, and confirmation logic into a single automated workflow, delivering clear trade levels with precise visual control and robust chart-safety handling. This is a price action and range-based trading indicator.
Background & History
Professional traders have long used candle range-based analysis to study market intent rather than indicators derived from lagging calculations. The concept focuses on how institutions accumulate positions within defined price ranges before inducing liquidity through false breakouts. Over time, this approach evolved into structured models that separate accumulation, manipulation, and confirmation phases. The Candle Theory Range Indicator formalises these ideas into a repeatable framework suitable for modern electronic trading platforms. By translating discretionary concepts into objective rules, it reduces the subjectivity traditionally associated with price action trading and enables traders to evaluate setups with greater consistency.
How the Indicator Works
The indicator analyses price across three distinct phases to identify valid trading opportunities. It first identifies an accumulation range using a user-defined higher timeframe. It then searches for price action that briefly breaks beyond this range, signalling potential manipulation. Finally, it waits for confirmation that the price has returned inside the range and accepted value.
-
Calculate the highest and lowest prices over the accumulation period.
-
Detect a bullish or bearish candle bias within the accumulation range.
-
Monitor recent price action for a false break beyond the range.
-
Require a defined number of confirmation bars back inside the range.
-
Plot entry, stop loss, and take profit levels automatically on the chart.
All visuals are drawn only when all conditions are met, reducing noise and false positives.
Key Features
The indicator provides a clean, structured view of candle-based range behaviour, with clear trade-level mapping.
-
Automatic accumulation of high and low detection.
-
Built-in manipulation and confirmation logic.
-
Clear entry, stop-loss, and take-profit projections.
-
Line or shaded rectangle visual styles.
-
Custom colours, labels, and opacity control.
-
On-chart confirmation text for directional bias.
How to Use it for Trading
Traders can use the indicator as a complete trade planning tool or as a confirmation layer within a broader strategy. A bullish setup forms when price accumulates, briefly breaks below the range, then closes back above the accumulation low with confirmation. A bearish setup follows the opposite logic. Once a signal appears, traders already have predefined entry, stop-loss, and take-profit levels on the chart.
For best results, traders should align signals with the higher timeframe trend and apply consistent risk management. Beginners can start by observing signals without trading, learning how the price behaves around the highlighted levels before committing capital.
-
Identify the accumulation range on the chart.
-
Wait for a confirmed buy or sell signal.
-
Use the plotted entry, stop-loss, and take-profit levels.
-
Confirm direction with a trend or momentum tool.
-
Manage risk by adjusting position size to stop distance.
Complimentary Indicators
This indicator works best when combined with tools that confirm trend strength and market context.
-
Moving Average or EMA trend filters.
-
Market structure or swing high-low indicators.
-
Volume-based indicators for validation.
-
Session or time-based indicators.
-
Higher timeframe support and resistance tools.
Inputs & Parameters
The indicator includes flexible inputs that allow traders to adapt the logic, visuals, and risk structure to their trading style. Accumulation, confirmation, and risk parameters can be fine-tuned independently, while visual settings control how information is displayed on the chart.
| Parameter |
Default/Type |
Description |
| Accumulation TimeFrame |
Hour |
Timeframe used to calculate the accumulation range. |
| Accumulation Length |
3 |
Number of candles used to define the accumulation range. |
| Manipulation Lookback |
50 |
How far back price is checked for a false break. |
| Confirmation Bars |
2 |
Number of bars required to confirm acceptance. |
| Confirmation Lookback |
30 |
Maximum bars to wait for confirmation. |
| Static Stop (pips) |
20 |
Fixed stop loss distance in pips. |
| Risk Reward |
2.0 |
Take profit multiplier relative to stop distance. |
Formula Explanation
The indicator is based on defining a price range, detecting a breach, and confirming acceptance back inside the range. The core calculations are expressed conceptually as follows.
Accumulation High = max(high over accumulation period)
Accumulation Low = min(low over accumulation period)
Stop Loss Distance = Stop Pips × Pip Size
Take Profit Distance = Stop Loss Distance × Risk Reward
Advantages
This approach provides a structured way to trade price action without relying on lagging indicators. It offers clear visual guidance, predefined risk levels, and objective confirmation rules. The flexible visual settings make it suitable for different chart styles, while the multi-phase logic helps filter out low-quality setups. It is especially useful for traders who prefer rule-based decision making grounded in market behaviour.
Disadvantages
The logic relies on sufficient market liquidity and may be less effective in very quiet or erratic conditions. As with all structured models, it may not capture every valid discretionary opportunity. Traders who prefer very fast scalping or fully automated execution may need additional filters or confirmation tools. Proper understanding of the accumulation and confirmation concepts is required to use it effectively.
How To Install & Remove
First, ensure the cTrader trading platform is installed. Then unzip the file and double-click it to install automatically.
Need Extra Help?
Get instant answers with cTrader Sensei — our free AI assistant built for the cTrader platform. It can explain the indicator settings, suggest trading strategies, and guide you step by step in using the indicator. Rated 4.9 out of 5 in the ChatGPT Store.
Chat with cTrader Sensei
Prefer human help? Visit our support forum where our team and community can assist you.


