History and Background
The Coppock Curve was developed in 1962 by economist Edwin Coppock, who was asked by the Episcopal Church to create a long-term investment model for identifying buying opportunities in the stock market. He approached it with a unique angle, asking how long it takes for people to recover from losses emotionally. Based on that idea, he combined the rate of change values over 11 and 14 months to create an indicator that would show when the market had bottomed out and was starting to recover.
Used initially on monthly charts for the S&P 500, the Coppock Curve was never meant for short-term trading. Over the years, traders began applying it to shorter timeframes, especially on modern platforms like cTrader. Its smooth, flowing curve makes it easier to spot major turning points—whether the market is pushing up or pulling back. What was once used mainly in slower markets has evolved into a versatile momentum tool that now supports a wide variety of trading strategies.
How the Indicator Works
The cTrader Coppock Curve is a momentum indicator that shows when a market may be bottoming out and ready to reverse upward. It works by combining two Rate of Change (ROC) calculations, typically over 11 and 14 periods, and then smoothing the result with a weighted moving average.
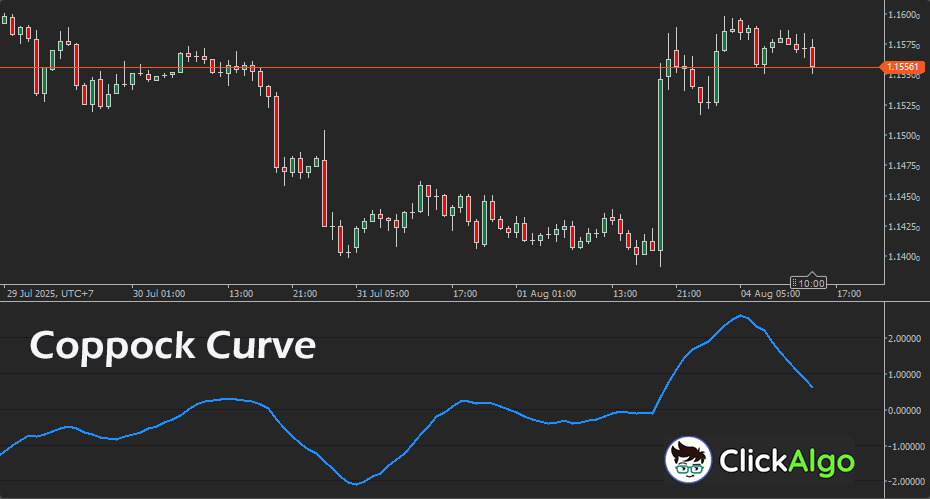
The Coppock Curve looks at how fast prices have been rising or falling over two different timeframes and blends that into one smooth line. When the curve turns upward from below zero, it's often read as a bullish sign, especially after a prolonged downtrend. If it's falling or turns downward, it can suggest that the momentum is fading.
The idea behind it is simple: markets usually need time to recover after significant market declines. This indicator helps spot when that recovery might be starting. It's not meant to give constant buy or sell signals, but rather to help identify major shifts, mainly on longer-term charts. That said, many traders now use it with shorter settings on faster timeframes, especially on platforms like cTrader.
Key Features
- Momentum-Based Reversal Signal
Designed to detect early signs of a bullish reversal, especially after extended downtrends.
- Dual Rate of Change Input
Combines two Rate of Change values to capture both medium and long-term price momentum.
- Smoothed Output
Uses a weighted moving average to create a clean, flowing curve that’s easy to interpret.
- Zero Line Reference
Crosses above the zero line often signal potential entry points, helping traders time their buys more effectively.
- Flexible Timeframes
Initially built for monthly charts, but this cTrader version can be customised for daily or even intraday use.
- Clear Visual Indicator
The curve’s turning points are easy to spot on a chart, making it useful even for less experienced traders.
- No Whipsaw Noise
Smoother than many short-term momentum indicators, it filters out minor fluctuations and focuses on bigger shifts.
How to Use the Coppock Curve
The Coppock Curve is useful when it turns upward from below zero; this move signals a shift from a negative to positive momentum after a prolonged downtrend. When the curve crosses above the zero line, traders commonly view it as a potential buy signal.
Unlike faster indicators that react to every market twitch, the Coppock Curve focuses on identifying longer, sustained moves. It tends to work best on higher timeframes like daily or weekly charts. That said, on platforms like cTrader, you can experiment with shorter settings if you prefer quicker signals.
The Coppock Curve was initially designed to identify market bottoms, not tops. Because of this, it’s mainly used to spot long entry opportunities. It is often combined with other tools such as:
- Trend filters
- Moving averages
- Support and resistance levels
Used as part of a broader strategy, the indicator can provide reliable momentum-based signals for long-term or position traders.
Coppock Curve Formula
The Coppock Curve is calculated using the following steps:
- Calculate the 11-period Rate of Change (ROC):
ROC11 = ((Current Price / Price 11 periods ago) - 1) × 100
- Calculate the 14-period Rate of Change (ROC):
ROC14 = ((Current Price / Price 14 periods ago) - 1) × 100
- Add the two ROC values:
ROC Sum = ROC11 + ROC14
- Apply a 10-period Weighted Moving Average (WMA) to the result:
Coppock Curve = WMA10(ROC Sum)
This results in a single line that smooths out short-term fluctuations and highlights shifts in long-term momentum.
The Coppock Curve is useful for spotting long-term bullish reversals, but it does have limitations. It was initially designed for monthly data, so on shorter timeframes it can produce delayed or less reliable signals. Because it focuses only on buy opportunities, it doesn't offer clear sell signals or help during sideways markets. The indicator also tends to lag behind fast price movements due to its smoothing, which means traders might miss the early part of a move. As with any standalone tool, relying solely on the Coppock Curve without additional confirmation can lead to false signals or late entries.
How To Install & Remove
First, ensure that you have the cTrader trading platform installed. Then, unzip the file and double-click it to install the platform automatically.
Need Extra Help?
Get instant answers with cTrader Sensei — our free AI assistant built for the cTrader platform. It can explain the indicator settings, suggest trading strategies, and guide you step-by-step through this indicator. Rated 4.9 out of 5 in the ChatGPT Store.
Chat with cTrader Sensei
Prefer human help? Visit our support forum where our team and community can assist you.
Note: cTrader Sensei runs on OpenAI's ChatGPT platform. To use it, you will be asked to create a free OpenAI account. Registration is quick and costs nothing.
The free version works immediately, but upgrading to a ChatGPT Plus subscription unlocks the latest GPT model, which provides more accurate and detailed answers for trading, coding, and product support.
To upgrade, log in to ChatGPT, click your profile in the bottom left, and select Upgrade to Plus.
Need a Broker
If you're still looking for a broker with tight spreads and fast execution, visit our top cTrader broker site.


