History of Candlestick Patterns
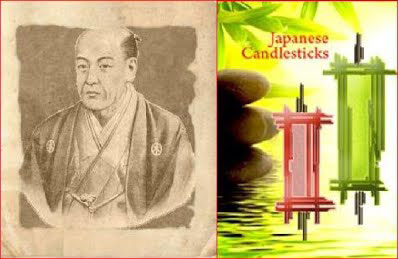
Japanese candlestick patterns have been around for centuries. Originally they were used by merchants to help them predict and profit from rice trading in the 18th century, Much of the credit for candlestick charting goes to Munehisa Homma (1724–1803), a rice merchant from Sakata, Japan who traded in the Ojima Rice market in Osaka during the Tokugawa Shogunate. You can say that they have really passed the test and are a “seasoned” tool for any financial market and if they were not reliable then they would have faded away many years ago, but today they are more useful than ever.

Why is the history of candlestick patterns important? History is not a favourite past time for traders and most traders do not care what happened in the past and they only focus on where the market is going now, but the lessons of the past repeat themselves time and time again.
- Pin Bar Candlestick Pattern
- Hammer Candlestick Pattern
- Doji Candlestick Pattern
- Bullish Engulfing Candlestick Pattern
- Bearish Engulfing Candlestick Pattern
Rice Trading in The 18th Century
The candlesticks have been used as far back as the 17th century, the first detailed documentation of candlestick patterns can be traced back to an 18th-century by a Japanese businessman named Munehisa Homma and he used candlesticks to chart and track rice contracts and at that time everyone was tracking rice contracts, but what he did was take an emotional approach to the market and he analyzed the fear, greed, and the herd mentality. He found a way to accurately observe the behaviour of the masses and manipulate them.
Who Made Up All The Candlestick Names?
Back in the 18th century, Japan Munehisa needed a way to link the chart patterns to some visual concept together with the tug of war between sellers and buyers in the market and so he labelled the names of specific candlestick patterns from mostly military concepts. Today some of the patterns have kept their original names, but some are now in English.

Candlestick Pattern Indicators Used With Trading
While there are many candlestick indicators available in the market, here at clickalgo.com have developed them so that the trader can receive an instant email, Telegram Bot and SMS text messages when the candle pattern forms, visit our product page to find out more information.


