Fibonacci Numbers Explained
How Fibonacci numbers are used in the Financial Markets to create technical indicators using a mathematical sequence developed by the Italian mathematician, commonly referred to as "Fibonacci," in the 13th century.
Who Was Fibonacci?
It may be worth sharing some history of who invented the Fibonacci numbers, he was an Italian mathematician from the Republic of Pisa who was considered to be the most talented Western mathematician of the Middle Ages and his real name is Leonardo Pisano Bigollo who was born in 1170 AD. The name he is commonly called is Fibonacci which was made up in 1838 by the Franco-Italian historian nearly 600 years after his death.
It is also amazing that modern-day traders use his formula nearly 800 years after his death and the Fibonacci sequence had been described by Indian mathematicians as early as the sixth century.

In the Fibonacci sequence, each number is the sum of the previous two numbers and Fibonacci omitted the '0' included today and began the sequence with 1, 1, 2, etc and he carried the calculation up to the thirteenth place to the value 233. This sequence can then be broken down into ratios which can provide clues as to where the financial market may move to.
How Are Fibonacci Numbers Used In The Financial Markets?
The two most common uses of Fibonacci numbers in the financial markets used with retracements and extensions, Fibonacci retracements measure how far a pullback could go. Fibonacci extensions measure how far an impulse wave could go.
Fibonacci numbers and lines are created by ratios found in Fibonacci's sequence where the most common numbers in financial markets are 0.236, 0.382, 0.618, 1.618, 2.618, 4.236. These ratios or percentages can be found by dividing certain numbers in the sequence by other numbers and while not officially numbers, traders also use 0.5, 1.0, and 2.0.
The Golden Ratio in Forex
The Golden ratio is a special number found by dividing a line into two parts so that the longer part divided by the smaller part is also equal to the whole length divided by the longer part. It is often symbolized using phi, after the 21st letter of the Greek alphabet.
a/b = (a+b)/a = 1.6180339887498948420 …
1.618 inverse equals 0.618 or 61.8%
The Magic of Fibonacci Numbers Video
By Arthur Benjamin | Duration: 6 minutes
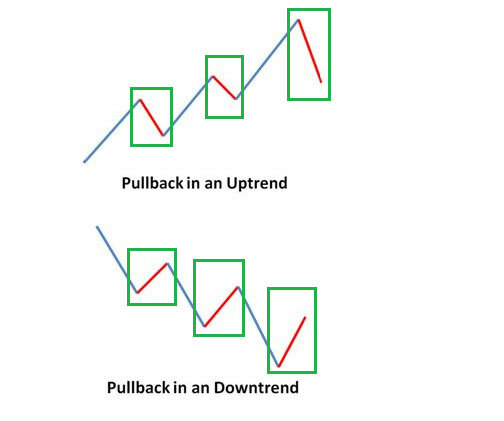
What is a Pullback?
A pullback or retracement is a price reversal in a stock, currency or commodities chart from recent peaks that occur within a continuing uptrend.
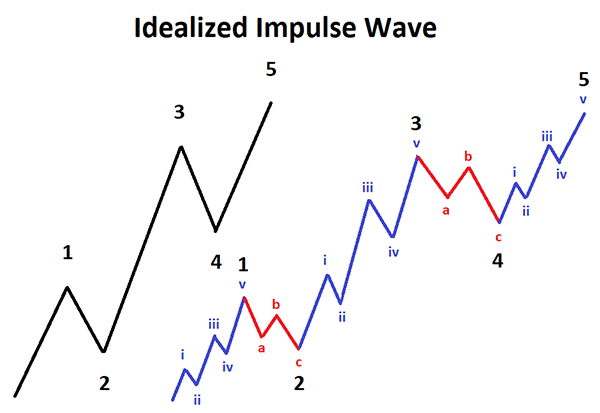
What Is an Impulse Wave?
An impulse wave is a technical trading term that defines a strong move in a financial instruments price coinciding with the main direction of the underlying trend. It is mainly used with the Elliott Wave theory which a method for analyzing and predicting financial market price movements
How We Calculate Fibonacci Retracement Levels
The Fibonacci number sequence can be used in different ways to get Fibonacci retracement levels or Fibonacci extension levels.
Fibonacci retracements require two price points to be chosen on a chart which is usually the last swing high price and the last swing low price and once those two points are chosen, the Fibonacci numbers and lines are drawn as percentages of that move.
What Are Fibonacci Extensions?
Fibonacci extensions are a tool that traders can use to set profit targets or estimate how far a price may travel after a retracement or pullback is finished, the extension levels are also potential areas where the price may reverse.
What Are Harmonic Patterns?
Harmonics is the process of identifying the market's rhythm or its pulse, and then exploiting its trading opportunities. They provide us with visual occurrences that have tendencies to repeat themselves over and over again. They are used in the financial markets to help predict price reversals.

Customer Rating 4.5 / 5
Based on verified reviews from our store.

