Pivot Points are significant support and resistance levels that can be used to determine potential trades. This version of the indicator includes four calculation types. It is well known that support and resistance levels are key trading tools in any market. There are many formulas for calculating the pivot point (P) of a Forex symbol, and the most common Classical is the arithmetic average of the high (H), low (L), and closing (C) prices of the previous trading period:
P = (H + L + C) / 3.
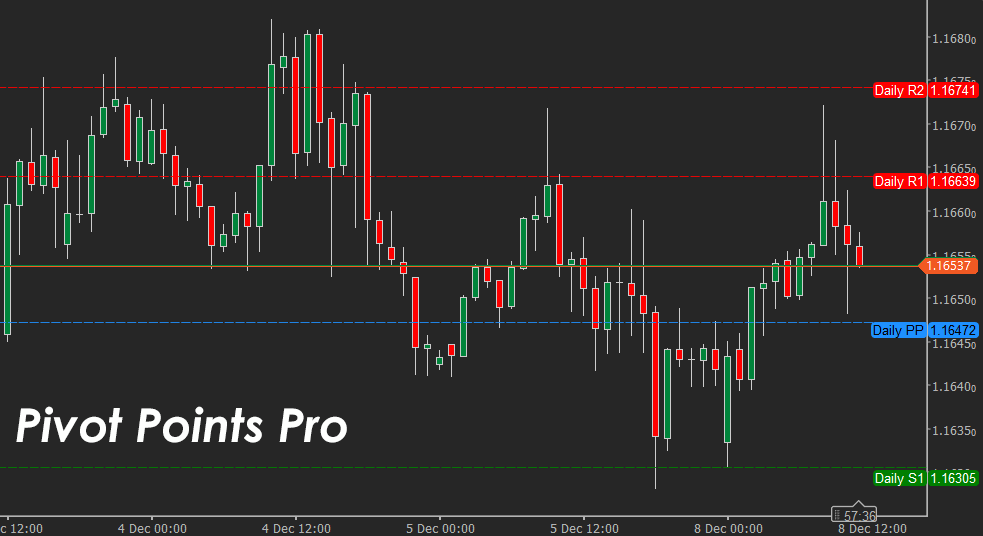
The main pivot point (PP) is the central pivot based on which all other pivot levels are calculated.
Usage Tips
- Pivot points are levels of support and resistance and can show market turning points.
- Pivot points can show many levels of support and resistance.
- Classical pivot points are calculated using the previous day's high, low & closing prices.
- Pivot points are used as exit points of trades but are rarely used as entry signals.
INDICATOR FEATURES
- Pivot point periods can be 1-hour, 4-hours, 8-hours, 12-hours, Daily, Weekly & Monthly.
- Four different types of Pivot Point calculations are shown below.
- Up to 4 different levels of support & resistance lines can be shown: R1, R2, R3 & R4.
- Option to change the colours of the lines.
- Option to show full, compact or hide the price labels.
- Option to change the pivot lines' thickness and type.
Types of Pivot Point Calculations
This indicator uses four calculation methods for the Pivot Points. You can research on the internet for more information about each one and how you would use it in your trading strategies, but below is a brief explanation of each one to help you get started.
Classical
This is the most widely recognised and commonly applied Pivot Point formula, used extensively across forex, equities and futures markets. The Classical method assumes that the market’s next trading session will react around the average price of the previous session. By using the arithmetic mean of the previous high, low and close, traders obtain a central reference point that often aligns with natural intraday turning zones. Support and resistance levels derived from this pivot are symmetrical and easy to interpret, making the Classical approach a reliable foundation for most strategies.
P = (H + L + C) / 3.
Fibonacci
Fibonacci Pivot Points expand on the Classical formula by incorporating Fibonacci ratios, which are widely observed in market behaviour. After calculating the central pivot in the normal way, the previous period’s range (high minus low) is multiplied by key Fibonacci coefficients such as 0.382, 0.618 and 1.000. These values are then added or subtracted from the pivot point to generate graded support and resistance levels. The result is a structure that many traders find more responsive to natural price swings, especially in trending or retracing markets.
Camarilla
Camarilla Pivot Points were introduced by bond trader Nick Scott in 1989 and quickly became known for their ability to identify short-term mean-reversion opportunities. Unlike the Classical method, Camarilla pivots use a set of fixed multipliers that compress the support and resistance zones closer to the current price. This produces eight levels—four support and four resistance—that act as dynamic boundaries during volatile sessions. Traders often use the inner levels for intraday reversals and the outer levels for breakout confirmation.
Woody
The Woody method adjusts the conventional pivot calculation by placing greater emphasis on the closing price and the distance between the previous session’s high and low. This weighting creates a central pivot that shifts more noticeably with directional momentum. As a result, Woody pivot levels can be particularly useful when markets display strong trending behaviour, as they adapt more quickly to recent price dynamics compared to the Classical approach.
How To Install & Remove
First, make sure you have the cTrader trading platform installed, then unzip the file and double-click it to install it on the platform automatically.
Any Questions?
If you have any questions or if there are any bugs, please first search our product help forum for the answer. If you cannot find it, post a new question.
Need a Broker
If you are still looking for a broker you can trust, take a look at our best cTrader broker site.


