cTrader Harmonic Gartley Pattern
This uses a different approach to trading the markets and is based on the discovery by H.M. Gartley who is a prominent technical analyst who published the book in 1935 entitled “Profits in the stock market”. The book was very detailed and was sold for a lot of money back when it was published. The most pattern was called the Gartley 222 Pattern, named after the page number where H. M. Gartley outlines the trading methodology using the Gartley pattern.
Traders that may have heard about the Gartley pattern will know their relation with Fibonacci numbers. Gartley never included the Fibonacci relation in his original work, but instead used one-thirds and two-thirds of ratios between the various swing moves and it was adopted by Scott Carney and widely used amongst traders today.
What Is The Gartley Pattern
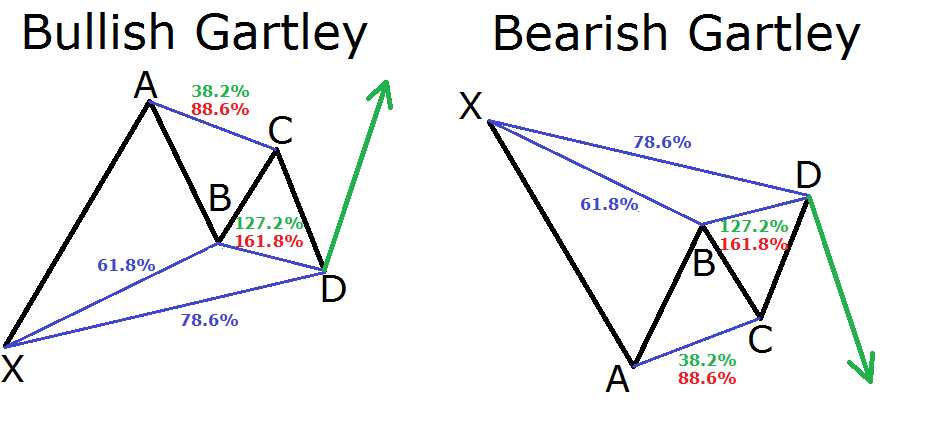
The Gartley Harmonic Pattern is a retracement pattern usually forms near the swing highs and lows in ideal conditions which involves 5 pivot or swings points. The main rules of the pattern are:
- AB must retrace 61.8% of the XA leg
- BC can retrace between 38.2% – 88.6% of AB
- CD can be an extension of 1.272% – 1.618% of AB
- CD can also be a retracement of up to 78.6% of XA leg
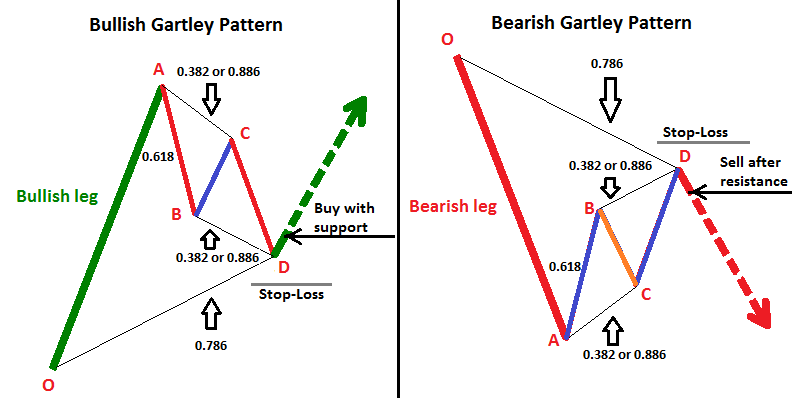
- The point D is known as the PRZ or Potential Reversal Zone
From Point D, a trade can be entered with stops at or above (below) the price point at X.
Target Levels for the Gartley 222 Pattern
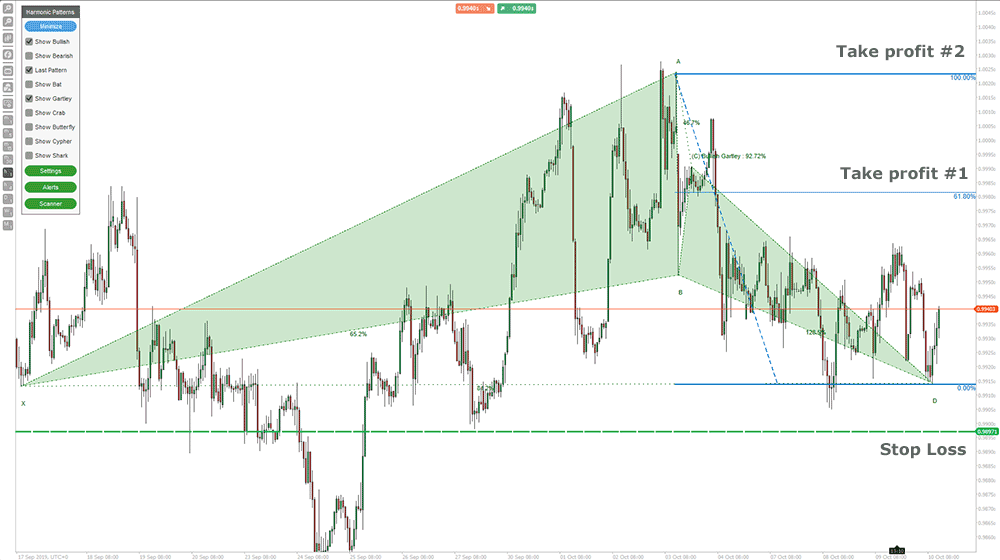
As soon as the D leg is completed and the pattern is formed a position is entered at D and a take profit can be taken at the golden ratio of 61.8% of CD with the second target being the measured XA, projected from D. We reduced the accuracy of this pattern to 92% so, it is not the perfect pattern, but it is just shown for demonstration purposes and when trading in real-time the markets don’t form Gartley patterns that fit the requirement to the point, so traders need to allow some room with a small margin of error.
The image below uses the cTrader Harmonic Scanning Software together with the Fibonacci Retracement Tool to help identify potential profit targets.
Conclusion
As we can see from the above image, the Gartley pattern is very simple and easy to understand for those who are just getting started with harmonic trading and when used with the Fibonacci Retracement indicator and the Support & Resistance Trading Zones indicator the trader will have some very powerful tools at their disposal.
Harmonic Pattern Trading
An advanced trading method like harmonic trading uses pure price action which has a determined system for price pattern recognition and Fibonacci techniques which cover the Harmonic Trading approach.

Customer Rating 4.5 / 5
Based on verified reviews from our store.

