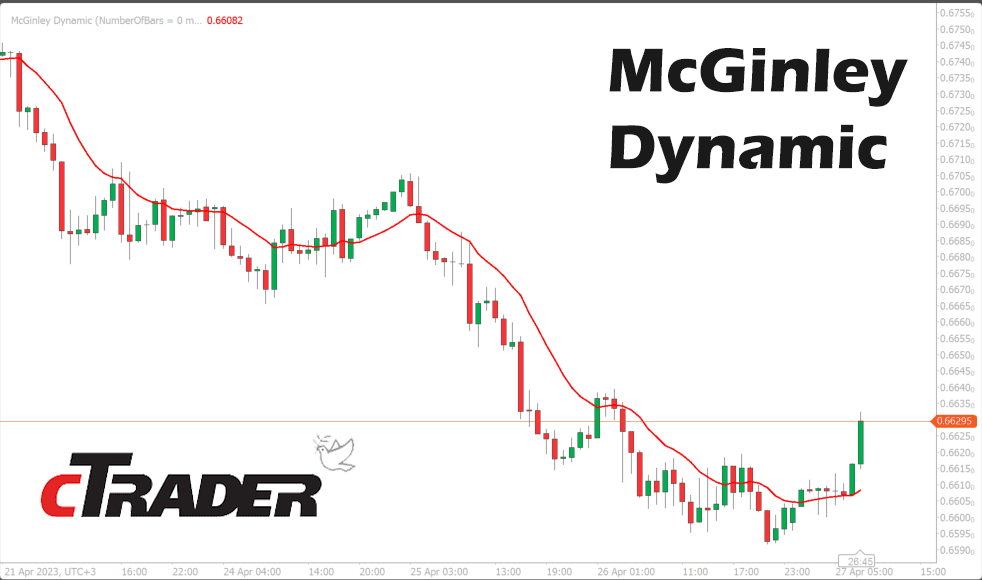
The McGinley Dynamic Indicator is a type of technical analysis tool used by traders to track the price movement of an asset. It is a type of moving average indicator that aims to improve upon traditional moving average lines by adjusting for shifts in market speed.
Unlike traditional moving averages, which use fixed periods to calculate the average price over a given time frame, the McGinley Dynamic adjusts its parameters based on the speed of the market. This means that the indicator is more responsive to changes in price, and can help traders identify trends and potential reversal points with greater accuracy.
The McGinley Dynamic is named after its creator, John R. McGinley, a market technician who developed the indicator in the 1990s. It is widely used in technical analysis by traders and investors across various financial markets, including stocks, futures, and currencies.

How to Use McGinley Dynamic
The McGinley Dynamic indicator is typically used in the same way as other moving average indicators but with some key differences. Here are some ways that traders can use the McGinley Dynamic indicator:
-
Trend identification: Traders can use the slope and position of the McGinley Dynamic line to identify the direction of the trend. If the line is sloping upwards and the price is above it, this could indicate a bullish trend. If the line is sloping downwards and the price is below it, this could indicate a bearish trend.
-
Reversal signals: The McGinley Dynamic can also be used to identify potential reversal points in the market. When the price crosses above the McGinley Dynamic line, it may signal a bullish reversal, and when the price crosses below the line, it may signal a bearish reversal.
-
Support and resistance levels: The McGinley Dynamic can also be used to identify potential support and resistance levels. Traders can look for instances where the price bounces off the McGinley Dynamic line to identify potential support levels, or where the price is rejected from the line to identify potential resistance levels.
It's worth noting that the McGinley Dynamic indicator should not be used in isolation, but rather in combination with other technical analysis tools and market indicators to confirm trading decisions. As with any trading strategy, it's important to test and validate its effectiveness before using it in live trading.

Disadvantages of a McKinley Indicator
While the McGinley Dynamic indicator has some advantages in terms of its ability to adapt to changes in market speed, there are also some potential disadvantages to consider:
-
Late signals: Because the McGinley Dynamic is designed to be more responsive to changes in price, it may also generate signals later than other moving average indicators. This could result in missed trading opportunities or delayed reactions to market trends.
-
Whipsaws: The McGinley Dynamic can also be prone to false signals or whipsaws, where the price briefly crosses the indicator line before reversing direction. This can lead to losses for traders who enter trades based on these signals.
-
Complexity: The McGinley Dynamic indicator is more complex than traditional moving average indicators, which could make it more difficult for some traders to understand and apply effectively.
-
Not universally accepted: While the McGinley Dynamic is widely used in technical analysis, it is not universally accepted or endorsed by all traders and analysts. Some traders may prefer other moving average indicators or technical analysis tools.
As with any trading strategy or indicator, it's important to weigh the potential advantages and disadvantages and use them in conjunction with other tools and analysis methods to make informed trading decisions.
Custom Parameters
There are a few custom settings for this indicator which are shown below.
- Bars Back - the number of historical candles to calculate.
- Periods - the period's value used in the calculation
- Smoothing - the value used in the formula to smooth the indicator.
How To Install & Remove
First, make sure you have the cTrader trading platform installed and then simply unzip the file and double-click on it to automatically install it onto the platform.
Any Questions?
If you have any questions, please first search our product help forum for the answer, if you cannot find it, post a new question.
Need a Broker
If you are still looking for a broker you can trust, take a look at our best cTrader broker site.


