Indicator Overview
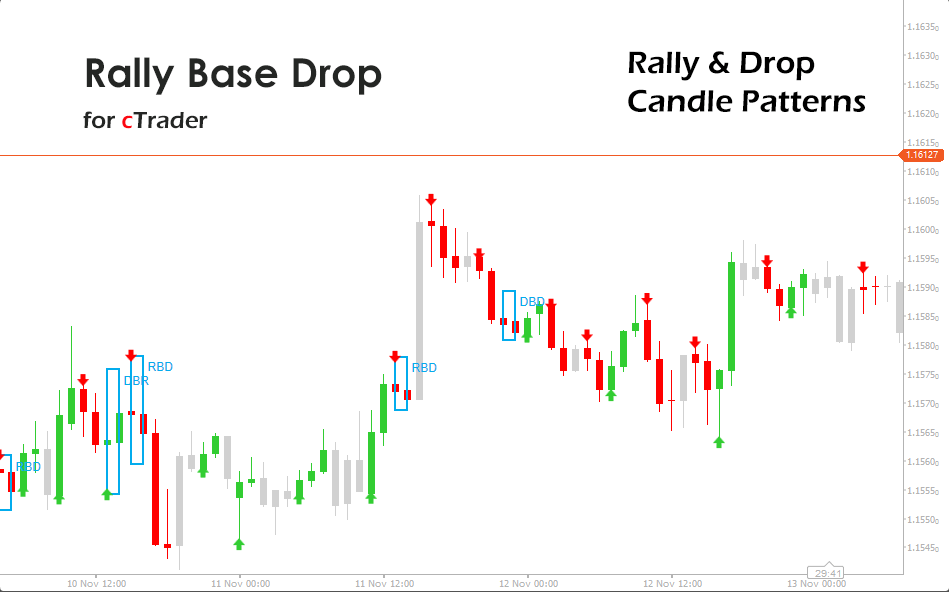
This indicator turns raw candlestick data into a structured map of impulse and pause behaviour. It identifies bullish impulse legs as Rally, bearish impulse legs as Drop, and transitional candles as Base. Using these building blocks, it detects common supply-and-demand sequences such as Rally Base Drop, Drop Base Rally, Rally Base Rally, and Drop Base Drop, then shades the base region to mark a potential decision zone. Traders can choose whether to colour all bars in a sequence or only the confirmation bar, and can display icons for new Rally or Drop clusters. The result is a clean overlay that reveals where aggressive buying or selling has stepped in, where the price paused, and where it may react again when the market revisits that area.
It is a price-action, supply-and-demand, pattern-recognition, and overlay indicator that draws structural zones and impulse icons directly on the chart.
i
A dedicated price action engine tracks every impulse and pause, then tags each candle as Rally, Base or Drop with intuitive colours. Automatic detection of pivotal sequences, such as Rally Base Drop and Drop Base Rally, draws precise supply and demand zones. Flexible bar colouring and icon options allow you to switch between educational, backtesting, and live trading modes without clutter. Non-repainting detection on the confirmation candle keeps historical data stable and reliable for strategy review.
Background & History
The logic behind Rally Base Drop analysis draws on classic supply-and-demand trading, price action theory, and institutional order flow concepts. Instead of focusing on single candlestick patterns, this approach studies how sequences of candles create imbalances between buyers and sellers. The Rally and Drop phases represent impulsive moves driven by strong order flow, while the Base marks a brief equilibrium before a new push. Over time, traders noticed that these formations often align with institutional order blocks and key liquidity zones. The indicator formalises this concept by defining objective rules for impulses and bases, then projecting their zones on the chart, allowing traders to apply a well-known discretionary method with consistent, rule-based execution inside cTrader.
How the Indicator Works
The indicator analyses recent candles for each incoming bar and counts the number of consecutive bullish or bearish closes within the Min Rally Drop Candles window. If all candles in that window close higher than they open, the cluster is classified as a Rally. If they all close lower than they open, the cluster is classified as a Drop. Any candle that does not fit either condition is treated as a Base and is coloured with a neutral tone. Once enough data is available, the script scans for a three-block structure of impulse, base, and impulse over two adjacent windows.
It checks whether the first window is a Rally or Drop, confirms that the middle region behaves like a compact base with relatively small candle bodies, then verifies whether the final window is bullish or bearish. When it matches a selected sequence, it computes the high and low of the base candles, draws a shaded rectangle across the base duration, and optionally labels it with the sequence code. Icons are plotted on the first candle of a new Rally or drop to mark fresh momentum events.
Key Features
This indicator focuses on clean visual structure, objective detection rules, and flexible display settings, so traders can integrate Rally, Base, and Drop behaviour into almost any price action or supply-and-demand strategy. It is designed for clarity on live charts as well as for historical review, helping you understand where institutional orders may be sitting and how the price reacts around those decision zones over time.
-
Automatically classifies candles as Rally, Base or Drop based on recent impulse strength.
-
Detects sequences such as Rally Base Drop, Drop Base Rally, Rally Base Rally, and Drop Base Drop.
-
Draws shaded rectangles around base regions to highlight supply and demand style zones.
-
Offers two bar colour modes, full sequence colouring or confirmation only, for live trading or study.
-
Plots optional bullish and bearish icons at the start of new impulse legs.
-
Includes label display for sequence codes to keep the chart easy to read.
How to Use it for Trading
Traders can use the overlay to locate high-quality reaction zones and structure-based trade locations. A Rally Base Drop often signals a newly formed supply area where strong sellers took control after a bullish move, while a Drop Base Rally highlights fresh demand where buyers stepped in after a bearish leg.
As prices revisit these zones in the future, traders can look for rejection candles, lower-timeframe patterns, or confluence with existing trend tools to refine entries. In a bullish context, Drop phases can be seen as corrective legs into demand, while in a bearish context, Rally phases can be treated as pullbacks into supply.
The indicator works particularly well when combined with sound risk management, fixed stop placements beyond the zone boundaries, and realistic profit targets aligned with recent structure highs or lows. Beginners can start simply by observing how the price reacts when it returns to a highlighted zone, then gradually add filters such as higher timeframe direction and volatility.
Quick steps for practical use.
-
Identify the main trend on a higher timeframe using moving averages or market structure.
-
On your trading timeframe, mark fresh Rally Base Drop and Drop Base Rally zones created in line with the higher timeframe bias.
-
Wait for the price to return to a selected zone and watch for rejection candles or clear failure to break through the zone.
-
Enter in the direction of the original impulse, placing stops beyond the zone boundaries.
-
Use nearby structure levels or a fixed risk-reward target to manage exits.
Complimentary Indicators
This tool is most effective when it is part of a broader trading framework that includes trend filters, volatility measures, and confirmation tools. Traders who already work with order blocks, support and resistance, or smart money concepts can use the zones from this indicator as primary areas of interest and then consult other indicators for additional confirmation. Pairing it with session-based tools, volume indicators, or higher timeframe structure dashboards can further improve selectivity and reduce noise.
Suggested complementary indicators.
-
cTrader Moving Average or Trend Filter Indicator.
-
cTrader Supply and Demand Zone or Order Block Indicator.
-
cTrader Support and Resistance or Pivot Levels Indicator.
-
cTrader Volume Profile or Cumulative Delta Indicator.
-
cTrader Volatility or ATR Channel Indicator.
Inputs & Parameters
The indicator offers a compact set of inputs that allow traders to control how impulses, bases, and sequences are detected and displayed. Detection settings define how many candles are required to confirm a Rally or Drop; sequence switches define which patterns are drawn; and style groups manage colours, labels, and icons. This allows you to tune the behaviour for fast intraday charts or slower swing trading timeframes without changing the core logic.
| Parameter |
Default/Type |
Description |
| Detection |
| Min Rally/Drop Candles |
2 |
Number of consecutive bullish or bearish candles required for a confirmed Rally or Drop. |
| Sequences |
| Show RBD (Rally Base Drop) |
true |
Displays bearish reversal style supply zones formed by a Rally, Base and Drop sequence. |
| Show DBR (Drop Base Rally) |
true |
Displays bullish reversal style demand zones formed by a Drop, Base and Rally sequence. |
| Show RBR (Rally Base Rally) |
false |
Displays bullish continuation zones formed by a Rally, Base and Rally sequence. |
| Show DBD (Drop Base Drop) |
false |
Displays bearish continuation zones formed by a Drop, Base and Drop sequence. |
| Style |
| Bar Color Logic |
FullColor, ColorOnDetection |
Choose whether to colour the entire impulse sequence or only the confirmation candle. |
| Colors |
| Rally Color |
LimeGreen |
Colour used to highlight bullish Rally candles. |
| Drop Color |
Red |
Colour used to highlight bearish Drop candles. |
| Base Color |
#73999999 |
Neutral tone applied to Base candles that form the consolidation zone. |
| Zone Colors |
| RBD/DBR Zone Color |
#FF03ACED |
Fill colour used when drawing supply and demand style zones. |
| Labels |
| Show Sequence Labels |
true |
Displays text labels such as RBD or DBR at the edge of each identified zone. |
| Icons |
| Show Bullish/Bearish Icons |
true |
Enables plotting of icons at the first candle of a new Rally or Drop. |
| Bullish Icon |
UpArrow |
Icon applied when a new bullish Rally impulse begins. |
| Bearish Icon |
DownArrow |
Icon applied when a new bearish Drop impulse begins. |
Formula Explanation
The core logic transforms raw open, high, low, and close data into categorical labels for each bar, then builds three block sequences from those labels. The formulas below summarise the key steps for impulse detection, base classification, and zone construction in a compact and implementation-friendly format.
1. Impulse Classification
If all candles in the last N bars close > open → Rally.
If all candles in the last N bars close < open → Drop.
Else → Base.
2. Base Condition
A Base is valid when:
| Close − Open | ≤ 2 × PipSize.
3. Sequence Logic
A sequence has three parts:
Impulse → Base → Impulse.
RBD = Rally → Base → Drop.
DBR = Drop → Base → Rally.
4. Zone Construction
ZoneHigh = highest High in the Base block.
ZoneLow = lowest Low in the Base block.
Draw rectangle between ZoneHigh and ZoneLow across BaseStart to BaseEnd.
Advantages
This tool gives traders an objective way to work with rally base drop logic without manually marking structures on the chart. Zones are drawn consistently, impulsive legs are identified with clear colours, and icons highlight fresh momentum shifts. The configuration is flexible enough to handle multiple markets and timeframes, and the non repainting detection on confirmation candles provides stable historical data for research and strategy refinement.
Disadvantages
Like all supply and demand style tools, this indicator can still flag zones that are later broken by strong trending moves or unexpected news events. It does not include built in alerts, volume analysis, or automatic multi timeframe confirmation, and it relies on the user to provide a solid trend filter and risk management plan. Traders who expect fully automated entries or exits will still need to combine it with other tools or cBots to create a complete trading system.
How To Install & Remove
First, ensure the cTrader trading platform is installed. Then unzip the file and double-click it to install automatically.
Need Extra Help?
Get instant answers with cTrader Sensei — our free AI assistant built for the cTrader platform. It can explain the indicator settings, suggest trading strategies, and guide you step-by-step in using this indicator. Rated 4.9 out of 5 in the ChatGPT Store.
Chat with cTrader Sensei.
Prefer human help? Visit our support forum where our team and community can assist you.


