What Type of Template is This?
This is a commonly used trading approach presented as an educational cBot template for cTrader. It demonstrates how to automate trend detection with optional risk-management rules. The example can be studied in both fully and semi-automated modes, and it is intended to show how such logic can be combined with other templates. Provided for educational use only. Not financial advice and not a performance-guaranteed trading system.

What is a Relative Strength Indicator (RSI)?
The RSI measures the ratio of up-moves to down-moves and normalises the calculation so that the index is expressed in a range of 0-100. It was originally developed by J.Welles Wilder. If the RSI is 70 or greater, the instrument is assumed to be overbought (a situation in which prices have risen more than market expectations). An RSI of 30 or less is taken as a signal that the instrument may be oversold (a situation in which prices have fallen more than the market expectations). Contrary to many opinions, the RSI is a leading indicator.
Free Training on Demo Account
We will show you how to optimise settings for any symbol you wish to trade while using the 14-day free trial download and backtest to verify the results, and we can also provide information on when to use different types of automated trading strategies.
Learn how to optimise and backtest any symbol, and define your risk vs reward.
What Results Can It Achieve?
It's essential to recognise that no automated trading system can consistently deliver positive results without active oversight. All trading bots, regardless of the strategy, require an experienced trader to monitor performance, adjust parameters, and make informed decisions based on changing market conditions. They are tools to support trading, not replacements for trader expertise.
How is it calculated?
The formula for the Forex RSI indicator involves two equations that are involved in solving the formula. The first component equation obtains the initial Relative Strength (RS) value, which is the ratio of the average UP closes to the average DOWN closes over 'N' periods, represented by the following formula:
RS = Average of 'N' day's closing UP/Average of 'N' days closes DOWN
The actual RSI value is calculated by indexing the indicator to 100 through the use of the following formula: RSI = 100 - (100 /1 + RS).
~ Only a single buy or sell position will be open at any time ~
Trade Rules
The following trade rules apply to open and close buy and sell positions, please note there are 2 modes of operational trade rules.
Mode-1 Standard Signals
The standard method of providing buy and sell signals is when the RSI value breaks above or below the upper or lower RSI thresholds, this is set by the cBot parameter setting Retracement Signal as No.
Bullish Signal - open buy
- RSI value drops below the lower threshold.
Bearish Signal - open sell
- RSI value rises above the upper threshold.
Mode-2 Retracement Signals
If you set the Retracement Signal parameter to Yes, then a buy or sell signal will happen when the price breaks through the upper or lower threshold and then retracements back again, the rules below explain this in more detail.
Bullish Signal - open buy
- RSI value drops below the lower threshold - 1st condition
- RSI value rises above the lower threshold. - SIGNAL
Bearish Signal - open sell
- RSI value rises above the upper threshold - 1st condition
- RSI value drops below the upper threshold - SIGNAL
Closing Positions
Whenever an opposite signal occurs a trade will close.
How Does This Trading Robot Work?
The core of the trading robot uses the classic RSI trading system where positions are opened when the RSI line breaks above or below upper and lower thresholds, additional logic has been added to improve performance and reduce false signals. Closing positions are very important and there are various optional methods a trader can use.
- Stop loss, Take Profit and Trailing stop loss
- Close on the reverse, this is very useful as it will keep a position open until the opposite signal occurs
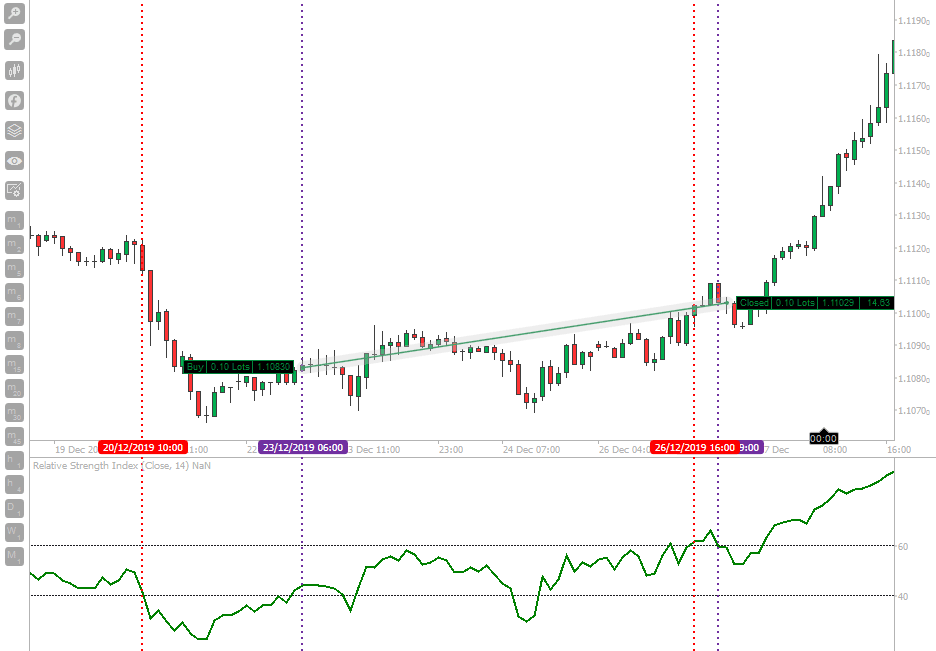
Visual Trade Rules
The chart above shows an example of a buy trade that opened not when the RSI value dropped below the lower threshold, but instead when passed back above the lower threshold, this provides a much more accurate trade entry. Also, the exit signal for the buy position is when there is a signal to open a sell position, so not when the RSI value passes above the upper threshold, but when it passes back below.
Trading Hours
This useful feature will allow you to set the start and end trading times, so you can avoid the most volatile periods, the optimum trading hours will differ for each instrument, but can easily be found using cAlgo's optimization feature.
Instant Window Popup, Email or Telegram Alerts
You can also show a pop-up window and have an email sent to you when any of the trade rules above are met.
- Symbol: EURUSD
- Timeframe: Hour
- Time: 12:34
- Price: 1.2295
- RSI value: 38
- RSI period: 14
- Trade direction: Buy
Option to Turn off Auto-Trading
With Auto-Trading turned off you can use this system as a signal generator to receive an email or a pop-up window.
Adjustable Settings & Features
We have made sure that you are not just buying a strategy that just opens and closes positions when the RSI is oversold or overbought, we have included the most valuable risk management and alert features that you will need to get the most out of this robot.
Include Buy or Sell
This feature will tell the trading system to only open buy or sell orders or both at the same time.
Max Trades Open
You can set the number of trades that will be open at any given time, useful to protect your account when you have many trades losing creating a drawdown.
Use Candle Close
This is a new setting not shown in the image above which is set to YES then the system will only check for a trade signal after the candle has closed, so if you have a 1-hour chart, the signal will not be checked until after 1-hour, this is the recommended setting as it filters many false signals.
False signals can occur if you set the Use Candle Close to No because the RSI value can move above and below a threshold many times in a second during high volatility.
How to Optimise Your Settings
We do not provide optimised settings for this robot, but if you are having difficulties in finding good settings for the symbol you wish to trade take a look at the forum link posted below by a customer.
Watch a Video Demonstration
The video has been uploaded to 1080p High Quality, so do not forget to set your YouTube video quality to 1080p HD.
Duration: 14 minutes

How To Install & Remove
First, ensure that you have the cTrader trading platform installed. Then, unzip the file and double-click it to automatically install the platform.
Need Extra Help?
Get instant answers with cTrader Sensei — our free AI assistant built for the cTrader platform. It can explain the indicator settings, suggest trading strategies, and guide you step-by-step through the use of this indicator. Rated 4.9 out of 5 in the ChatGPT Store.
Chat with cTrader Sensei
Prefer human help? Visit our support forum where our team and community can assist you.
Note: cTrader Sensei runs on OpenAI's ChatGPT platform. To use it, you will be asked to create a free OpenAI account. Registration is quick and costs nothing.
The free version works immediately, but upgrading to a ChatGPT Plus subscription unlocks the latest GPT model, which provides more accurate and detailed answers for trading, coding, and product support.
To upgrade, log in to ChatGPT, click your profile in the bottom left corner, and select 'Upgrade to Plus'.
Need a Broker
If you're still looking for a broker with tight spreads and fast execution, visit our top cTrader broker site.


