Indicator Overview
The cTrader Smoothed Double Moving Average Indicator refines trend-following signals using a two-stage smoothing process. It calculates a first simple moving average (SMA) of the chosen price source and then applies another SMA to that result, creating a smoother curve that filters out short-term volatility. It also includes a standard SMA for comparison, and crossover points between the two can be used to identify possible entry or exit points.
Background & History
Moving averages are among the oldest and most trusted indicators in technical analysis. The concept of double smoothing has been used by traders seeking to eliminate market noise while retaining meaningful trend information. This approach draws on classic methods such as the Double Exponential Moving Average (DEMA) and the Smoothed Moving Average (SMMA), blending them to achieve both responsiveness and smoothness.
How the Indicator Works
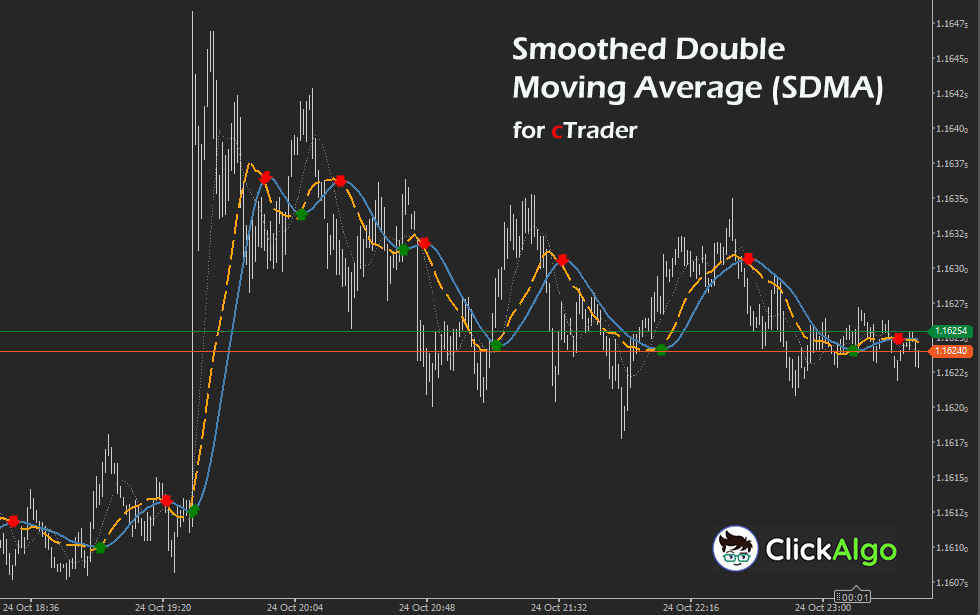
The SDMA Indicator analyses price data from a selected source, such as closing, opening, or median prices. It first computes a simple moving average (SMA) of that data over a short period, then applies another SMA to the first result to produce the Smoothed Double Moving Average. Alongside this, it calculates a standard SMA for comparison.
When the SDMA crosses above the standard SMA, it suggests potential bullish momentum; when it crosses below, it may indicate bearish pressure. The indicator plots both lines on the chart and marks crossover points with arrows. Optional pop-up or Telegram alerts notify the trader of these crossovers in real time.
Key Features
This indicator combines the clarity of smoothed averages with the responsiveness of crossovers, making it a versatile trend tool.
-
Double smoothing process for noise reduction.
-
Optional pop-up and Telegram alerts for signal events.
-
Customisable periods and colours for each moving average.
-
Supports various price sources, including close, high, and weighted prices.
-
Non-repainting design for reliable backtesting.
How Traders Can Use this Indicator
Traders can use this indicator to identify trend reversals and confirm the market's direction. When the SDMA crosses above the standard SMA, it often signals the start of an upward trend, while a cross below the SMA may signal a downtrend.
For confirmation, traders can combine this with volume-based or momentum indicators. For instance, a bullish SDMA crossover aligned with a strong RSI or MACD reading provides stronger conviction for long entries. Beginners can start by using default settings and observing how crossovers align with broader market movements before integrating it into automated strategies or trade management plans.
Complimentary Indicators
The Smoothed Double Moving Average works well alongside other analytical tools that confirm market momentum or strength.
-
Relative Strength Index (RSI): Helps determine whether a crossover occurs in overbought or oversold territory.
-
MACD (Moving Average Convergence Divergence): Enhances confirmation of bullish or bearish momentum.
-
Volume Oscillator: Supports SDMA signals by showing whether trading volume aligns with price movement.
-
Average True Range (ATR): Assists in setting stop-loss or profit targets during volatile periods.
Inputs & Parameters
The SDMA Indicator includes grouped input parameters to offer flexibility and user control.
| Parameter |
Default/Type |
Description |
| First SMA Period |
10 (int) |
Defines the length of the initial SMA applied to the price data. |
| Second SMA Period |
20 (int) |
Defines the smoothing period applied to the first SMA result. |
| Standard SMA Period |
20 (int) |
Period of the standard SMA used for crossover comparison. |
| Source |
Close (enum) |
Defines which price type to use, such as close, open, or median. |
| Show Popup Notification |
True (bool) |
Enables on-screen alerts when a crossover occurs. |
| Show Telegram Alert |
False (bool) |
Sends real-time alerts to a Telegram channel or chat using bot credentials. |
Telegram Alerts
When a signal occurs, the indicator will send a Telegram alert directly to your PC or mobile device.
Formula Explanation
The Smoothed Double Moving Average (SDMA) is calculated by applying two sequential moving averages to a selected price source.
FirstSMA = SMA(Source, FirstPeriod)
SDMA = SMA(FirstSMA, SecondPeriod)
StandardSMA = SMA(Source, StandardPeriod)
Advantages
The SDMA Indicator reduces market noise and smooths price fluctuations, giving traders a clearer view of dominant trends. It offers early and accurate crossover signals, flexible configuration, and optional alert systems that adapt to different trading environments.
Disadvantages
Because of the double smoothing, the indicator can lag during fast-moving markets, which might delay some entry or exit signals. It is best used with confirmation tools to avoid false signals in ranging conditions.
How To Install & Remove
First, ensure the cTrader trading platform is installed. Then unzip the file and double-click it to automatically install the platform.
Need Extra Help?
Get instant answers with cTrader Sensei — our free AI assistant built for the cTrader platform. It can explain the indicator settings, suggest trading strategies, and guide you step-by-step in using this indicator. Rated 4.9 out of 5 in the ChatGPT Store.
Chat with cTrader Sensei.
Prefer human help? Visit our support forum where our team and community can assist you.
Note: cTrader Sensei runs on OpenAI's ChatGPT platform. To use it, you will be asked to create a free OpenAI account. Registration is quick and costs nothing.
The free version works immediately, but upgrading to a ChatGPT Plus subscription unlocks access to the latest GPT model, which provides more accurate, detailed answers for trading, coding, and product support.
Need a Broker
If you're still looking for a broker with tight spreads and fast execution, visit our top cTrader broker site.


