The Volume Gap Indicator is a technical analysis tool used in trading to measure the difference between the buy and sell volume of a security or asset over a particular period. It displays two separate lines representing the estimated average buy and sell volumes, and the gap between them indicates the level of buying or selling pressure in the market. A large gap between the two lines suggests a stronger bullish or bearish sentiment, depending on which line is higher, and can be used by traders to make trading decisions.
Volume Gap Indicator Overview
The Volume Gap Indicator can be used in different ways depending on the trading strategy and the time frame being analyzed. Here are some common ways to use this indicator:
1. Confirming Price Movements: The Volume Gap Indicator can help confirm price movements in the market. For instance, if the price of a security is increasing, but the buy volume line is decreasing, it may suggest that the price movement is not sustainable, and a reversal may occur.
2. Identifying Support and Resistance Levels: Traders can use the Volume Gap Indicator to identify potential support and resistance levels. If the sell volume line is higher than the buy volume line, it may suggest that there is more selling pressure, and the price may find resistance at that level. Conversely, if the buy volume line is higher, it may indicate support levels.
3. Divergence Trading: Traders can also use the divergence between the Volume Gap Indicator and the price chart to identify potential trading opportunities. For example, if the price is making higher highs, but the buy volume line is making lower highs, it may suggest that the price movement is losing momentum and a reversal may occur.
How to Use The Volume Gap Indicator
To use a Volume Gap Indicator, follow these steps:
-
Open your trading platform and select the security or asset you want to analyze.
-
Add the Volume Gap Indicator to your chart by selecting it from the list of technical analysis tools.
-
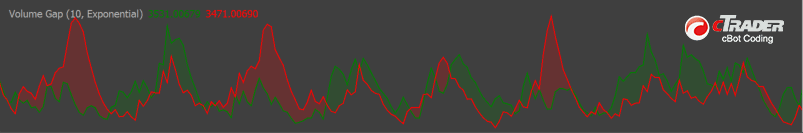
Look at the two lines displayed by the indicator. The line representing the buy volume is usually green, and the line representing the sell volume is usually red.
-
Observe the gap between the two lines. A wider gap indicates stronger buying or selling pressure.
-
Consider the direction of the gap. If the buy volume line is higher than the sell volume line, it suggests a bullish sentiment, while if the sell volume line is higher, it suggests a bearish sentiment.
-
Use the information from the indicator to make trading decisions. For example, if you see a large gap in favour of buying, you might consider opening a long position, and if you see a large gap in favour of selling, you might consider opening a short position.
It's important to note that the Volume Gap Indicator is just one tool to use in trading, and should be used in conjunction with other technical analysis and fundamental analysis tools to make informed trading decisions.

Disadvantages of a McKinley Indicator
Like any other technical analysis tool, the Volume Gap Indicator has some limitations and drawbacks that traders should be aware of. Here are some disadvantages of the Volume Gap Indicator:
Lagging Indicator
The Volume Gap Indicator is a lagging indicator, meaning that it relies on past price and volume data to provide signals. It may not capture sudden changes or unexpected events that could affect the market sentiment, such as news or economic reports.
Limited Information
The Volume Gap Indicator provides limited information about the market dynamics. It only shows the difference between the buy and sell volumes, but it does not provide information about the actual buyers and sellers, their motives, or the order book depth.
False Signals
Like any other technical analysis tool, the Volume Gap Indicator can generate false signals. It may signal a bullish or bearish trend, but the trend may not materialize, leading to losses for traders.
Not Suitable for All Markets
The Volume Gap Indicator may not be suitable for all markets or securities. It works best for highly liquid markets with frequent price and volume movements, such as stocks or forex. It may not be effective for illiquid or low-volume markets, such as penny stocks or some cryptocurrencies.
Overreliance on Indicators
Traders should avoid overreliance on the Volume Gap Indicator or any other technical analysis tool. It should be used in conjunction with other indicators, such as moving averages, trend lines, or oscillators, and fundamental analysis to make informed trading decisions.
Overall, the Volume Gap Indicator can be a useful tool for traders, but it should be used with caution and in conjunction with other analysis techniques to avoid false signals and losses.
Custom Parameters
There are a few custom settings for this indicator which are shown below.
- Periods - the number of periods to calculate.
- Type - choose from 7 different types of moving averages.
How To Install & Remove
First, make sure you have the cTrader trading platform installed and then simply unzip the file and double-click on it to automatically install it onto the platform.
Any Questions?
If you have any questions, please first search our product help forum for the answer, if you cannot find it, post a new question.
Need a Broker
If you are still looking for a broker you can trust, take a look at our best cTrader broker site.


