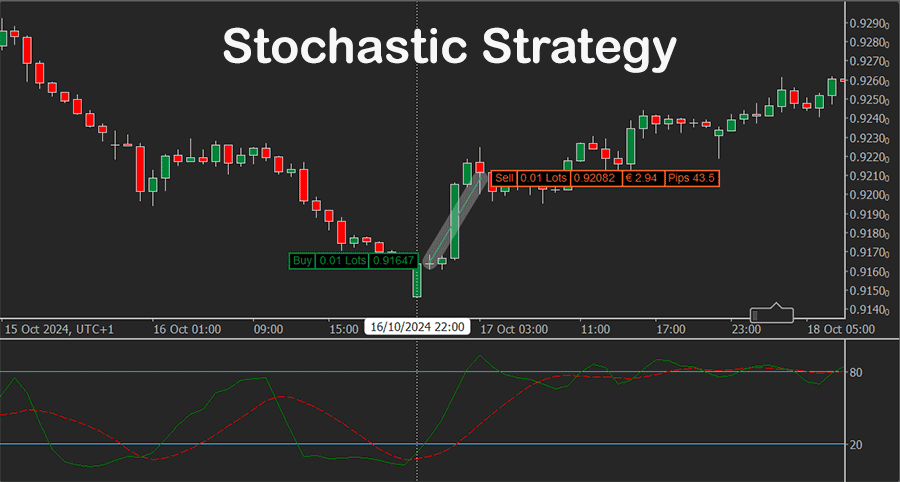
The Stochastic Oscillator indicator was developed by George Lane in the 1950s, this oscillator compares the current closing price of an asset to its price range over a specified period, typically producing values between 0 and 100. It is a momentum indicator used in technical analysis to determine if an asset is overbought or oversold, helping traders identify potential trend reversals. It measures the closing price of an asset relative to its price range over a specified period, typically 14 days.
The indicator ranges from 0 to 100, where readings above 80 suggest overbought conditions and readings below 20 indicate oversold conditions. It consists of two lines: the %K line, which tracks the current price position within the range, and the %D line, which is a moving average of %K, often used as a signal line. When %K crosses %D, it can indicate potential buy or sell signals, providing insights into trend momentum and helping traders anticipate price changes.

Indicator Overview
- %K line: The main line, shows the current closing price about recent highs and lows.
- %D line: A 3-day simple moving average of the %K, used to smooth out short-term fluctuations.
- Overbought and Oversold Levels: Usually, values above 80 indicate overbought conditions, and below 20 indicate oversold conditions, signalling potential reversals.
-
Overbought/Oversold Reversals
- Sell signal: When the oscillator rises above 80 (overbought) and then drops below it, it can signal a possible bearish reversal.
- Buy signal: When the oscillator falls below 20 (oversold) and then crosses above it, it may indicate a bullish reversal.
- Buy signal: When the %K line crosses above the %D line, it may signal bullish momentum.
- Sell signal: When the %K line crosses below the %D line, it suggests bearish momentum.
To filter false signals, traders often combine the stochastic oscillator with trend indicators like moving averages, RSI, or MACD to increase the accuracy of trade signals. Exiting a trade based on crossing back into neutral territory (between 20 and 80) or trailing stops are common techniques. This can help manage risks, as stochastic signals can sometimes be early or react to price noise.
Features Included
The features included in this cBot are as follows:
- Position size.
- Stop loss and take a profit.
- maximum spread limiter.
- Close trade on the reverse signal.
- Trailing stop loss.
- Break-even stop loss.
- Email alerts.
- Telegram alerts.
- Stochastic Oscillator settings for both a buy and sell signal.
The strategy contains the full source code. It is for educational purposes to help traders with various levels of programming knowledge learn the following skills using Microsoft C# and the cTrader API. This cBot was created by the ClickAlgo Strategy Building Tool in a few minutes with no coding.
Risk Management
In addition to the trade signals to open trades automatically, the cBot also uses some basic risk management in the form of the variable position size based on the percentage of the account balance.
You can add risk management features and other trade rules by contacting our development team.
Built Using the Algo Strategy Builder
This cBot was built with no coding required using the cTrader Algorithmic Strategy Builder for the cTrader Platform.
How To View The Source Code
To view the source code for this cBot, you will first need to make sure you have downloaded and installed cTrader Desktop, you can also scroll to the bottom of this page for instructions on how to install the cBot. Once installed you will have the cTrader application open, you need to navigate to the Automate application and click on the name of the cBot, the source should show in the right-hand window.
If you need more help watch a video tutorial on how to use cTrader Automate.
Algorithmic Trading Facts
Many traders venture into algorithmic trading with the misconception that they have discovered a foolproof strategy that guarantees effortless wealth. However, this notion is far from reality.
How To Install & Remove
First, make sure you have the cTrader trading platform installed.
Any Questions?
If you have any questions, please first search our coding help forum for the answer, if you cannot find it, post a new question.
Need a Broker
If you are still looking for a trustful broker, look at our best cTrader broker site.
All cBot Code Examples
You can access all of our free cTrader cBot code examples here.


