The Relative Strength Index (RSI) is a popular technical analysis indicator used in financial markets to measure the strength and momentum of price movements. It was developed by J. Welles Wilder Jr. and introduced in his book "New Concepts in Technical Trading Systems" in 1978.
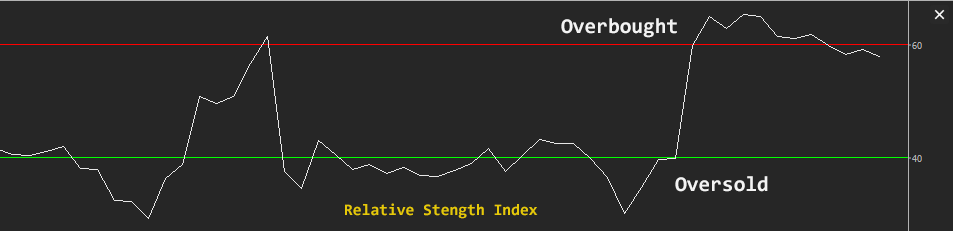
The RSI is a bounded oscillator that ranges from 0 to 100 and is displayed on the cTrader chart as a line graph, and it calculates and compares the magnitude of recent gains and losses over a specified period, typically 14 trading days (periods), and generates a value that reflects the overbought or oversold conditions of a symbol.
The formula for calculating the Relative Strength Indicator involves calculating the average of upward price changes and the average of downward price changes over the specified period, and the resulting values are then used to determine the relative strength and plotted on a scale of 0 to 100. If the RSI value is above 70 it is considered overbought and a value below 30 is typically considered oversold, suggesting that the asset may be undervalued and due for a potential price rebound.
How Does the cBot Open & Close Trades?
-
Signal Generation: The trading robot continuously monitors the RSI value and when it rises above the upper level, it generates a buy signal, indicating a potential uptrend. When the RSI value crosses below the lower level, it generates a sell signal, indicating a potential downtrend.
-
Trade Execution: Once a buy or sell signal is generated, the trading robot automatically executes the corresponding trade, either buying or selling for the symbol selected for the cBot instance.
-
Risk Management: The trading robot typically incorporates risk management measures, such as stop-loss orders or position sizing, to limit potential losses and manage overall portfolio risk. Trades can also be closed in opposite directions when there is a signal generation.
- Concurrent trades: the single trade option allows only 1 trade to open at any time or multiple transactions on each signal generation.
As with all technical indicators, the RSI is not foolproof and can generate false signals as it can give overbought or oversold readings for an extended period before an actual price reversal occurs. You should exercise caution and consider using additional indicators or analysis techniques to confirm the signals.
The formula for calculating the Relative Strength Index (RSI) is as follows:
Calculate the average gain (AG) and average loss (AL) over a specified period (default 14 days).
- AG = Sum of gains over the period/number of periods.
- AL = Sum of losses over the period/number of periods.
Gains are the positive differences between consecutive closing prices, losses are the negative differences.
We calculate the relative strength by dividing the average gain by the average loss.
RS = AG / AL
Now we can calculate the RSI value to plot to the chart.
RSI = 100 - (100 / (1 + RS))
You can add additional risk management and other trade rules yourself or by contacting our development team.

How to Optimise the Settings
We have also created a simple video showing how you can run cTrader Automate Optimisation for the Relative Strength Index (RSI) cBot to find the optimal parameter values.
Purchase Ready Made RSI cBot
You may be interested in a ready-made RSI automated trading robot complete with risk management and other trade rules.
How to Attach Indicator to Chart
You do not need to attach the Parabolic SAR indicator to your chart when you run the cBot, but it is a good idea to visually see the indicator to check your trade rules for opening and closing trades and any risk management.
How To View The Source Code
To view the source code for this cBot, you will first need to make sure you have downloaded and installed cTrader Desktop, you can also scroll to the bottom of this page for instructions on how to install the cBot. Once installed you will have the cTrader application open, next you need to navigate to the Automate application and click on the name of the cBot, the source should show in the right-hand window.
If you need more help watch a video tutorial on how to use cTrader Automate.
Learn Algorithmic Trading
In this instructional guide, we aim to assist you in acquiring the necessary skills to engage in market trading through automated trading strategies (cBots) using the cTrader Desktop trading platform. By the conclusion of this tutorial, you will gain the confidence to employ a cTrader cBot alongside the Algo application of cTrader, enabling you to automatically execute and handle your market orders. This course is designed to familiarize novice traders with the fundamental principles of algorithmic trading utilizing the cTrader platform.
Learn Microsoft C# for Algo Trading
If you are new to coding your own cTrader cBot for automated trading the following Microsoft C# course will help you modify the starter kit cBot in this download to add new features for your own personal trading strategy.
Algorithmic Trading Facts
A significant number of traders venture into algorithmic trading with the misconception that they have discovered a foolproof strategy that guarantees effortless wealth. However, this notion is far from reality. It is crucial to read this article, as it can save you valuable time and money.
How To Install & Remove
First, make sure you have the cTrader trading platform installed and then simply unzip the file and double-click on it to automatically install it onto the platform.

Any Questions?
If you have any questions, please first search our coding help forum for the answer, if you cannot find it, post a new question.
Need Coding Help?
We can help you modify this cBot for your own personal trading strategy, contact our team for a quote.
Need a Broker
If you are still looking for a broker you can trust, take a look at our best cTrader broker site.


