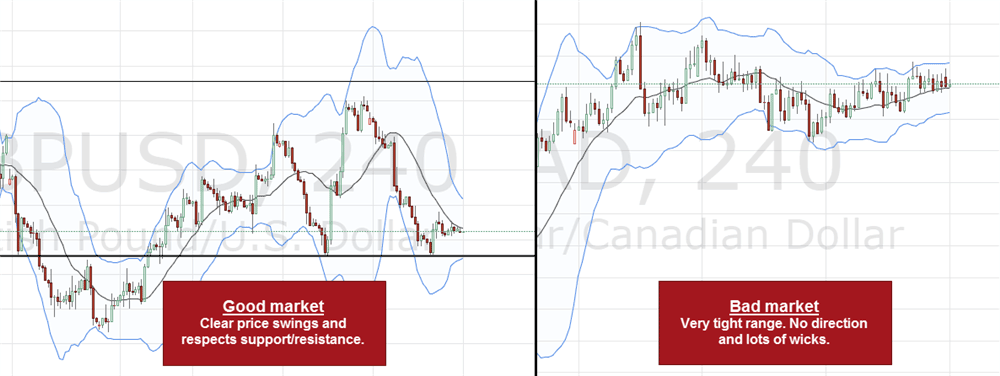
Building a watch list prior to your trading is important and market selection is a very misunderstood concept in trading. An effective market selection is important and you should only look for markets that offer clear price action and stay away from markets that are too erratic and noisy. Don’t make this mistake of being too fixated on the pairs you trade – rotate them and only focus on markets with good price action.
This is a versatile volatility indicator, derived from BollingerBands and uses an originally calculating formula to show the dominating price direction. It is very simple to identify dominating price direction by simply reading the trend signal: Bullish, Bearish or Range

Volatility indicators show the size and the magnitude of price fluctuations, providing insight into the market activity level. In any market, there are periods of high volatility (high intensity) and low volatility (low intensity). These periods come in waves: low volatility is replaced by increasing volatility, while after a period of high volatility, there comes a period of low volatility and so on.
Low volatility suggests very little interest in the price, but at the same time, it reminds us that the market is resting before a new large move. Low volatility periods are used to set up the breakout trades.
Another thing to remember about volatility is that while low volatility can hold for an extended period of time, high volatility is not that durable and often disappears much sooner.
The Bollinger Bands are a technical indicator based on price volatility, which means that they expand when the price fluctuates and trends strongly, and the Bands contract during sideways consolidations and low momentum trends.
Bollinger Bands are among the most reliable and potent trading indicators traders can choose from. They can be used to read the trend strength, to time entries during range markets and to find potential market tops. The indicator is also not a lagging indicator because it always adjusts to price action in real time and uses volatility to adjust to the current environment.
During ranges, the price fluctuates around the moving average, but the outer Bands are still very important. When the price touches the outer Bands during a range, it can often foreshadow the reversal in the opposite direction when it’s followed by a rejection. So, even though moving averages lose their validity during ranges, the Bollinger Bands are a great tool that still allows you to analyze prices effectively.
How To Use This Indicator
There are just a few things you need to pay attention to when it comes to using BBands to analyze trend strength.
During strong trends, the price stays close to the outer band
If the price pulls away from the outer band as the trend continues, it shows fading momentum
Repeated pushes into the outer bands that don’t actually reach the band show a lack of power
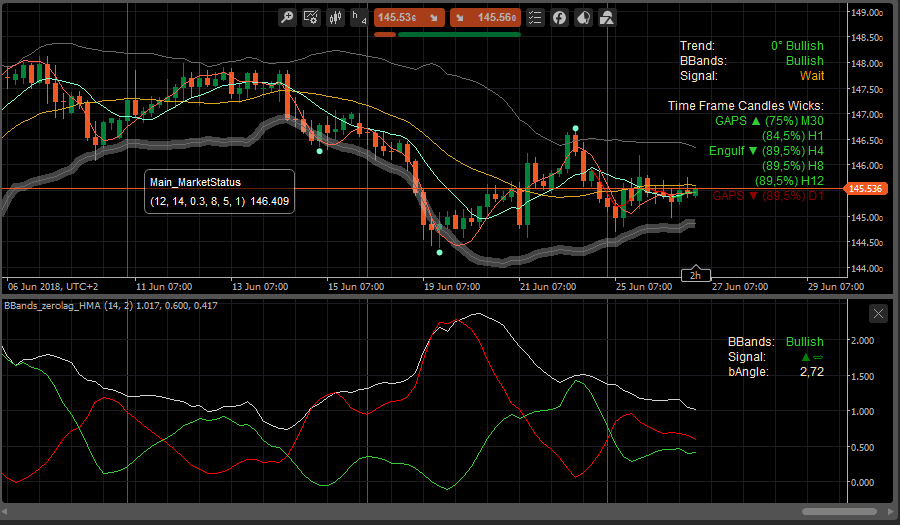
~ PLEASE NOTE THAT THIS PRODUCT IS THE INDICATOR AT THE BOTTOM OF THE CHART ONLY ~
Include the Market Status indicator for a perfect trade setup, this indicator is shown at the top of the chart

During trends, BBands can help you stay in the trades. During a strong trend, the price usually pulls away from its moving average, but it moves close to the Outer Band. When the price then breaks the moving average again, it can signal a change in direction. For example, when the bands of the BBands indicator squeeze tight and the Bollinger bands angle (bAngle) has a value usually lower than 3,2, you traders anticipate an explosive breakout way outside the bands limit.
So long as the down difference line (green) is the upper up difference line (red) the price-dominating direction is Bullish. In that situation, the signal for a Bullish trend comes when the down difference line (green) is growing and the difference line (red) and vice versa. When both are rising or falling, the market is in a consolidating period.
Finding The Tops and Bottoms with Bollinger Bands
We highly recommend combining the Bollinger Bands with the RSI indicator – it’s the perfect match. There are two types of tops that you need to know about:
- After a trend move, the price fails to reach the outer Band as the uptrend becomes weaker. This signal is usually accompanied by an RSI divergence
- During a consolidation, price spikes into the outer Bands which get rejected immediately
The BBands are a multi-faceted trading indicator that can provide you with lots of information about the trend, buy/seller balances and potential trend shifts. Together with the MACD, CCI and the RSI, BBands make for a great foundation for a trading strategy. Using this you can avoid opening a trade position when the trend going in range.
By default, the BBands are set to 2.1 Standard deviations which means that, from a statistical perspective, 95% of all the price action happens in between the channels. A move closer to them, or outside of the outer BBands shows a significant price move – more on that later.


Telegram & Email Signal Alerts
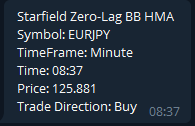
You can receive either an email or an instant Telegram message direct to your PC or mobile phone the moment this indicator shows a signal to enter a trade.

Conditions for the Alert Signals
The following conditions must be true to send a buy signal alert, the reverse applies to sell signals:
- BBands: Bullish
- Signal: Bullish.
How To Install & Remove
First, ensure that you have the cTrader trading platform installed. Then, unzip the file and double-click it to automatically install the platform.
Need Extra Help?
Get instant answers with cTrader Sensei — our free AI assistant built for the cTrader platform. It can explain the indicator settings, suggest trading strategies, and guide you step-by-step through the use of this indicator. Rated 4.9 out of 5 in the ChatGPT Store.
Chat with cTrader Sensei
Prefer human help? Visit our support forum where our team and community can assist you.
Note: cTrader Sensei runs on OpenAI's ChatGPT platform. To use it, you will be asked to create a free OpenAI account. Registration is quick and costs nothing.
The free version works immediately, but upgrading to a ChatGPT Plus subscription unlocks the latest GPT model, which provides more accurate and detailed answers for trading, coding, and product support.


