Technical indicators are widely used in trading to analyze historical price data and identify potential trade signals. This Indicator is pretty accurate and shows a lot of useful information for the traders to help them enter trades with confidence.
- Market volatility value (BBands signal)
- Trend direction (Trend signal)
- Trend continuation or periods of market consolidation (Signal value)
- Periods of upcoming large volatility breakouts (BollingerBands piercing signals - bullets)
- Timeframe (30min,1H, 4H, 8H,12H, 1Day, 1Week) values of candlestick wicks and Bearish/Bullish Engulfing, Gaps, Harami and Doji/Hammer patterns.
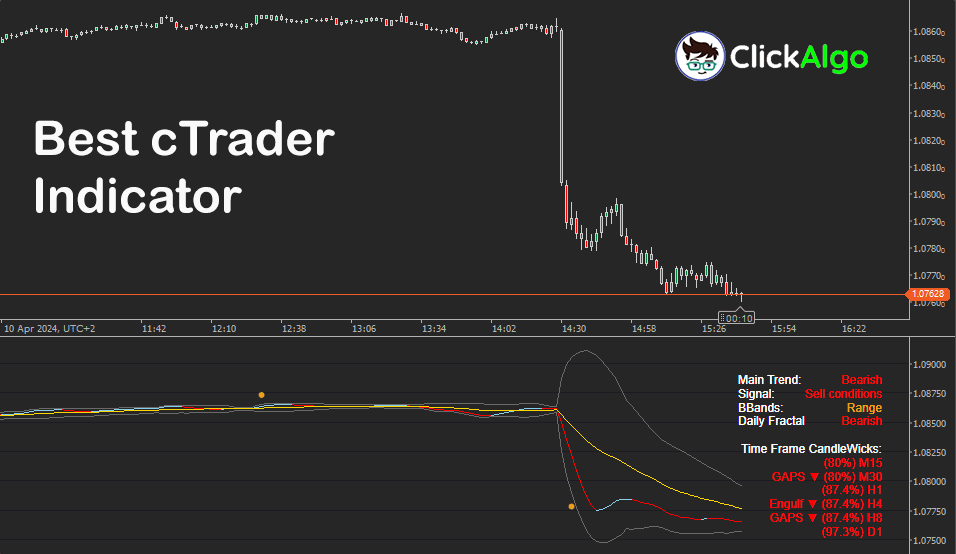
The percentage figure next to the various time-frames is calculated after the candle wicks formula and price action if you require more information click here
The calculating formula for this is in a tight correlation with the time frame price action and time frame trend. For a better understanding, these values are colour-coded (red for bearish trend, green for bullish trend and orange for range)
The percentage figure represents a reference to that particular timeframe and the degree number concerning the trend refers to the SMA(9) slope trend calculated in correlation with the HMA slope. Together (SMA(9) and HMA(14) give an accurate image of the trend. (bullish when the degree is positive and bearish when the degree value is negative)
Trend direction (Trend signal and angle)
- If HMA is greater than SMA and BBands signal in Bullish – uptrend.
- If HMA is lower then SMA and BBands signal are Bearish - downtrend.
Telegram Alerts Configuration
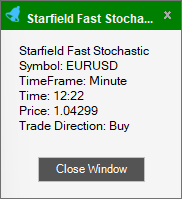
When there is a trade signal you can get a free instant telegram message.
Install the Telegram App on your mobile phone or PC and receive free instant messages, you no longer need to pay using an SMS service.
Conditions for the Alert Signals
The following conditions must be true to send a buy signal alert, the reverse applies to sell signals:
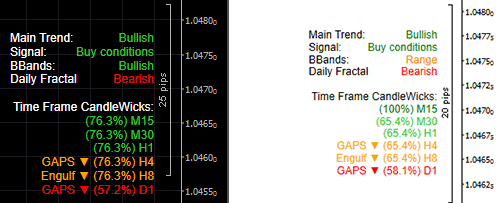
- Main Trend: Bullish
- Signal: Buy Conditions.
- Bollinger Bands: Bullish.
- Daily Fractal: Bullish.
Additional Signals Included
Some very important signals have been included with this indicator.
- A trend line, calculated after a CCI and tick volume formula, (the line blue/red)
- A signal about the daily fractal value (the blue points on the graphic)
- A signal about the Bollinger Bands inverted candles (the yellow points on the graphic) – that works like reverting signals and is enough accurate (if used together with another indicator, respectively, trend slope, Dynamic RSI and MACD_Histogram)
Theme Option
If you choose a white or black chart background you will need to select the correct theme in the settings, black or white.
Market Volatility Value (BBands signal)
When the market becomes more volatile, the bands will correspond by widening and moving away from the middle line. When the market slows down and becomes less volatile, the bands will move closer together.
It is very simple to identify the dominating price direction by simply reading the trend signal: Bullish, Bearish or Range
And just in case you’ve missed the beginning of the trend, Bollinger Bands can help you get in the trend with a good risk-to-reward ratio on a pullback.
Simply look for dips towards the middle Bollinger Bands line and enter in the direction of the trend.
When Bollinger Bands start to narrow down to the point when they are visually forming a neat tight range (measured by our proprietary formulas and not empirically) the situation signals an upcoming increase in volatility once the market breaks outside the bands. It is similar to a quiet time before the storm.
Price moves outside the bands – trend continuation
When the price moves and closes outside the Bollinger upper or lower bands, it implies a continuation of the trend. With it, Bollinger Bands continue to widen as volatility rises.
Bollinger Bands alone are not able to identify continuation and reversal patterns and require support from other indicators. For this, we recommend using this indicator together with our Dynamic RSI, zero-lag MACD histogram, CCI WWS HeikenAshi and Fast Stochastic (momentum, volume and market strength indicators).
Trend Reversal Patterns with Bollinger Bands
As a rule, a candle closing outside Bollinger Bands followed later by a candle closing inside the Bollinger Bands serves as an early signal of forming a trend reversal. It is, however, not a 100% assurance of an immediate trend reversal. (See the blue bullets from the next image)
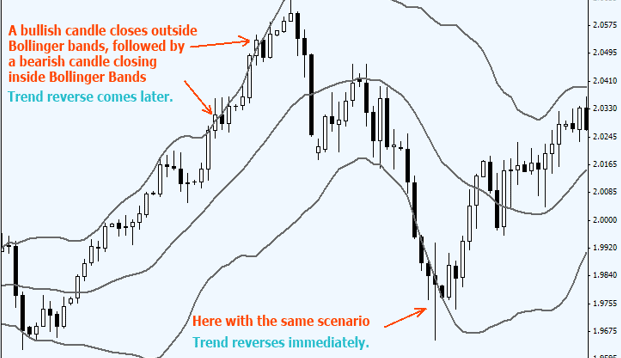
Since a long aggressive trend develops not that often, there will be in general more reversals than continuation cases, still, only filter signals from other indicators may help to spot true and false market tops and bottoms.
How To Install & Remove
First, make sure you have the cTrader trading platform installed and then simply unzip the file and double-click on it to automatically install it onto the platform.
Need Extra Help?
Get instant answers with cTrader Sensei — our free AI assistant built for the cTrader platform. It can explain the indicator settings, suggest trading strategies, and guide you step-by-step through the use of this indicator. Rated 4.9 out of 5 in the ChatGPT Store.
Chat with cTrader Sensei
Prefer human help? Visit our support forum where our team and community can assist you.
Note: cTrader Sensei runs on OpenAI's ChatGPT platform. To use it, you will be asked to create a free OpenAI account. Registration is quick and costs nothing.
The free version works immediately, but upgrading to a ChatGPT Plus subscription unlocks the latest GPT model, which provides more accurate and detailed answers for trading, coding, and product support.
Need a Broker
If you're still looking for a broker with tight spreads and fast execution, visit our top cTrader broker site.


