The Average True Range (ATR) is a technical indicator commonly used in financial analysis, particularly in the field of trading and investing that was developed by J. Welles Wilder Jr. and introduced in his book "New Concepts in Technical Trading Systems" in 1978.
The ATR is designed to measure the volatility or price range of any cTrader symbol over a specified period of time as it provides traders and analysts with insights into how much the symbol's price has moved in any timeframe. You might drag the line and anchor the VWAP to a significant news event, an earnings announcement, or a major market shift as this could help traders and analysts better understand how the VWAP has performed and interacted with price movements since that anchor point.
The Fibonacci formula included in this indicator is a technical analysis tool used in financial markets to identify potential levels of support and resistance in a price chart. It's based on the Fibonacci sequence, a mathematical sequence of numbers where each number is the sum of the two preceding ones (e.g., 0, 1, 1, 2, 3, 5, 8, 13, 21, and so on).
Fibonacci was invented by Leonardo of Pisa, who lived in the 12th and 13th centuries he was one of the most influential mathematicians of the Middle Ages and played a crucial role in introducing mathematical concepts to Europe. Fibonacci retracement levels are calculated by applying ratios derived from the Fibonacci sequence to price movements, the key Fibonacci retracement levels used in this indicator are:
How to Use the ATR Fibo Indicator?
When you attach the indicator to a chart (scroll to the bottom of the page for instructions) you will be able to adjust the settings for both the ATR indicator and the Fibonacci indicator, the default settings are the best, but you can experiment with other settings for different symbols and market conditions.
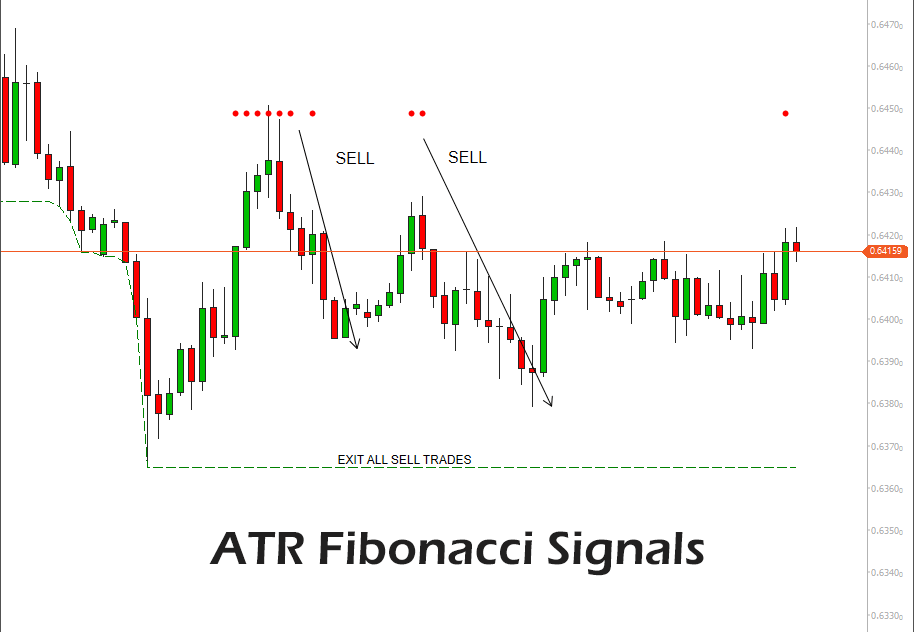
This indicator is very simple and easy to use for all traders, you just wait until you see Buy or Sell dots appearing near the candles, the more dots that are formed the stronger the signal for a trend reversal. We suggest that you hold the trade until you either want to take a profit or until the price reaches the Exit Level line.
Sometimes when you see the dots to confirm a buy or sell opportunity, set your stop loss at a level to allow the price to breathe before it reverses. Also, be aware that sometimes it will not reverse, but instead close on a stop loss at a loss.

Indicator Settings Explained
When you attach the indicator to a chart or edit the indicator settings, you will have various adjustments you can make.
- User Guide - This displays a popup on the chart with a button that will take you to this page for help.
- ATR Period - The periods used for the average true range indicator.
- ATR Factor - This is the colour of the vertical line that you can drag left or right (the anchor).
- Fib Level 1 - Fibonacci retracement level 1 percentage used to calculate signals.
- Fib Level 2 - Fibonacci retracement level 1 percentage used to calculate signals.
- Fib Level 3 - Fibonacci retracement level 1 percentage used to calculate signals.
ATR Periods
The ATR indicator measures volatility, taking into account any gaps in the price movement and the calculation is based on 14 periods, which can be intraday, daily, weekly, or monthly.
- To measure recent volatility, use a shorter average, such as 2 to 10 periods.
- For longer-term volatility, use 20 to 50 periods.
Important Information
As with all technical indicators, use this indicator in conjunction with other indicators and your manual strategy as a confirmation, there are too many variables in the market to trade with a single indicator. Use your current trading skills to analyse what is happening in the markets before making a decision to open, close or modify a trade.
How To Install & Remove
First, make sure you have the cTrader trading platform installed and then unzip the file and double-click on it to automatically install it onto the platform.
Any Questions?
If you have any questions or if there are any bugs, please first search our product help forum for the answer, if you cannot find it, post a new question.
Need a Broker
If you are still looking for a broker you can trust, take a look at our best cTrader broker site.


