Fibonacci retracements are used to break an entire price movement into percentage brackets. The percentages used are based on the “Golden Ratio” found in the Fibonacci sequence. Retracements are drawn either from the highest high to the lowest low, or vice versa, depending on which direction the price moved. The brackets produced can then be used as support & resistance levels.
Fibonacci channels combine these two tools, bracketing price action within an identifiable channel and then subdividing that channel by Fibonacci percentages. The channel can then also be extrapolated to predict probable areas of rejection outside the channel, following a break-out.
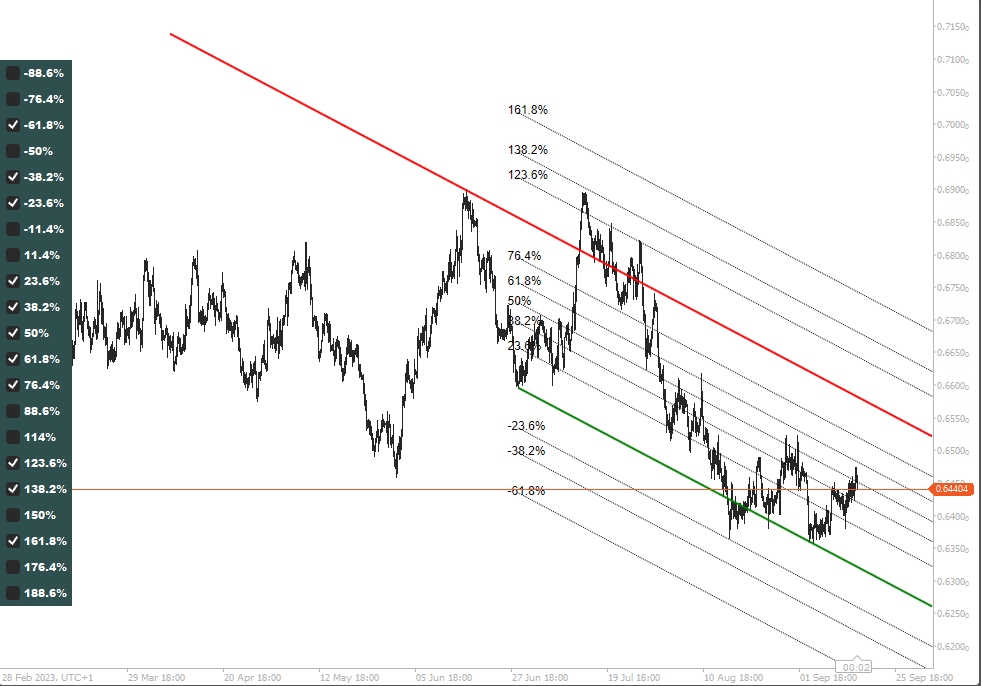
How to use the Fibonacci Channels
The Trend Lines component of this combined indicator scans through price history, from the most recent bar, comparing all open prices and all closed prices independently. When it determines it has found price rejection in either series of data, it marks that point and then continues until it finds the next point. Then it draws two trend lines, one upper line for the high prices, and one lower line for the low prices.
If a prevailing trend is detected, the stronger of the two lines will provide the basis for the channel and the weaker will be adjusted to lie parallel to it. The channel will then be divided into the levels selected.
If the trend lines identified converge (point towards one another) or diverge (point away from one another), the lines will be displayed as trend lines and the indicator will declare that no prevailing trend was found.
Trend line/channel price movements conventionally follow a rule of three. Two points form the line, traders then look to the third touch to indicate a possible trade. With each additional touch of the line, the likelihood of a break increases. Once the price has broken the trend line, a retest may indicate conditions for further trades.
If a channel has formed and Fibonacci levels are displayed, these levels can be used to estimate how far the price may move before potential reversal:
Fibonacci Channel Example Signal
Example: A channel forms with the dominant line on top and the submissive line below. The dominant line has been formed from two points and below are increasing Fibonacci levels. A sale is placed when the price touches the line for the third time. A trader may choose to take full profit when the price reverses to the first (23.6%) level, or partial profits at each level hit. The stop loss is placed an equal distance to the opposite side (-23.6%) and typically moved to trail the price as it hits successive levels. The trade is closed when the price reaches the opposing side of the channel or the SL is hit. When the price reaches the upper line a fourth time, a breakout is awaited.
N.B. Different instruments respond more or less strongly to each level. One currency pair may nearly always respond to the 38.2% level while another may largely ignore it.
Adjustable Settings
The Look Back Period determines the initial range in which the indicator should search for rejection, and then how far back it should search beyond that. By default, the look-back period is set to 30 bars (of a chosen time frame) to capture one month (assuming the indicator is set to use the daily timeframe). Increasing look back will draw longer trendlines using older data, reducing it will only capture the most recent price action.
Series Timeframe determines the timeframe data used for calculating channels/trend lines. A user can thereby view a chart of one timeframe overlaid with the data of another (e.g. H1 chart with D1 data). This allows data from multiple timeframes to be overlaid on the same chart for comparison. By default, the indicator loads Daily data.
The Stack Panel is provided with default levels, additional levels can be toggled on and off with the checkboxes.
Summary
With an instance of the indicator loaded, a user can select a timeframe of interest and view the channel overlaid on the chart. A user can select their preferred Fibonacci levels from the panel to subdivide the channel.

How To Install & Remove
First, make sure you have the cTrader trading platform installed and then simply unzip the file and double-click on it to automatically install it onto the platform.
Any Questions?
If you have any questions, please first search our product help forum for the answer, if you cannot find it, post a new question.
Need a Broker
If you are still looking for a broker you can trust, take a look at our best cTrader broker site.


