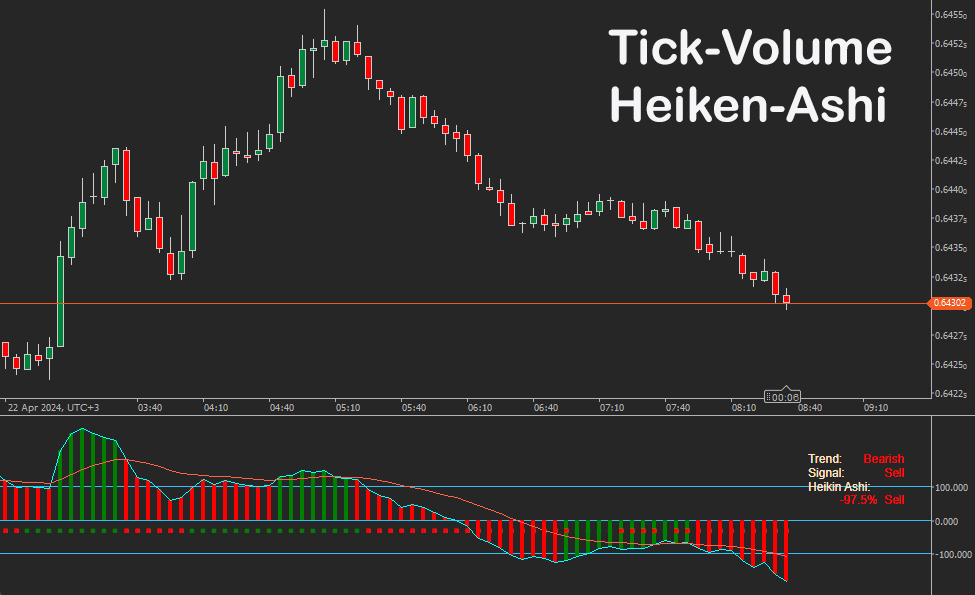
Large volume signifies that there is a large number of market participants involved, including financial institutions. The last ones bring the highest turnover to the market, and if they are trading, it means the interest on the price at a certain point and/or on the trend overall is high.
Volume is the second most valuable data after the price itself.
Small volume tells that there are very few participants in the market, and neither buyers nor sellers have any significant interest in the price. In addition, no financial institutions will be involved, thus a market is going to be moved only by individual traders and so the move will be weak.

Volume - Quick Summary
- Trading with Volume indicator offers the following features:
- Volume confirms the strength of a trend or suggests its weakness.
- A rising volume indicates rising interest among traders, while a falling volume suggests a decline in interest.
- Points where the market trades on high volume are the points of strong support and resistance.
- All various kinds of breakouts and market spikes can be validated or voided with the help of the Volume indicator.
Volume and Trend
- Volume helps to learn about the health of a trend.
- An uptrend is strong and healthy if Volume increases as the price moves with the trend and decreases when the price goes counter-trend (correction periods).
- When the price is going up and volume is decreasing, it tells traders that a trend is unlikely to continue. Price may still attempt to increase at a slower pace, but once sellers get a grip on it (which will be signified by an increase in volume on a down candle), the price will fall.
- A downtrend is strong and healthy if volume increases as prices move lower and decreases when it begins retracing upwards. When the price is falling and volume is dropping, the downtrend is unlikely to continue. The price will either continue to decrease, but at a slower pace or start to rise.
Volume and Reversals
To understand the nature of a spike in volume before a trend reversal, traders need to know how the data for volume indicators are gathered in Forex.
When the volume rises, it means lots of participants are actively selling and buying currencies. When volume spikes at a certain price level, traders know that there was lots of interest shown by traders at that price level. If there is a lot of interest, it means the level is an important one. This simple observation of a volume indicator allows for identifying important Support and Resistance levels, which would certainly play a significant role in the future.
How To Combine Other Indicators For Great Trade Signals
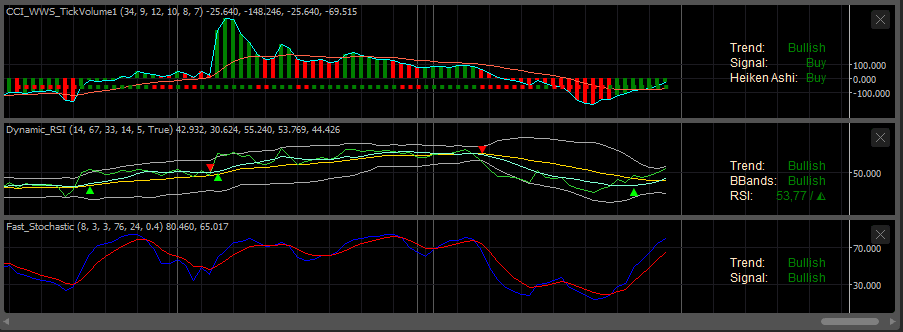
This indicator can be combined with the Dynamic RSI and a Fast Stochastic to provide a strong indication that the trend has reversed so you can open a position with a higher probability of success.

Volume indicator helps to validate all kinds of breakouts
A breakout occurring on rising volume is a valid breakout, while a breakout that caused no interest from traders as it is happening on a low volume is more likely a false one.
The Commodity Channel Index (CCI) is a hugely popular indicator among traders. Although novice traders tend to pay little attention to CCI at the beginning of their learning curve, later they return to discover amazing potential and the beautiful simplicity of the CCI indicator.
CCI indicator was created to identify bullish and bearish market cycles as well as to define market turning points and market strongest and weakest periods.
Fundamentals of trading with the CCI TickVolume indicator
When CCI moves above +100, there is a strong uptrend confirmed, therefore traders should open a Buy position. The trade is held as long as CCI trades above +100. Exits will be made when CCI goes back below +100. The Opposite is true for downtrends and readings below -100.
CCI and its Zero line
An aggressive way to enter the market is to react to CCI's line crossing its zero levels. When CCI moves above Zero, traders will Buy the currency expecting a newly changed trend to hold. Vice versa, when CCI falls below zero, traders would Sell looking to benefit from early signals of an emerging downtrend.
Like all indicators created from Starfield, all the status information is displayed on the top right of the indicator to help you understand the market conditions.
We strongly recommend using the CCI WWS TickVolume indicator in association with Dynamic RSI, MACD and Stochastic for the best accurate market signal.
Telegram Alerts
When a signal occurs, the indicator will send a Telegram alert directly to your PC or mobile device.
Conditions for the Alert Signals
The following conditions must be true to send a buy signal alert, the reverse applies to sell signals:
- Main Trend: Bullish
- Signal: Bullish.
- Heiken Ashi: 100% Buy.
How To Install & Remove
First, make sure you have the cTrader trading platform installed and then unzip the file and double-click on it to automatically install it onto the platform.
Any Questions?
If you have any questions, please first search our product help forum for the answer, and if you cannot find it, post a new question.
Need a Broker
If you are still looking for a trustworthy broker, look at our best cTrader broker site.


